Graphic flow analysis
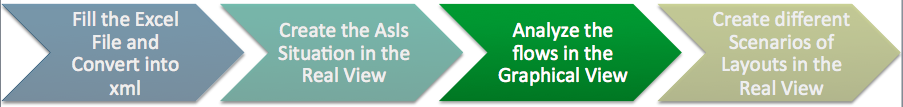
Graphical view
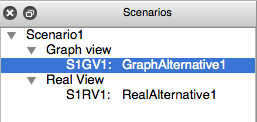
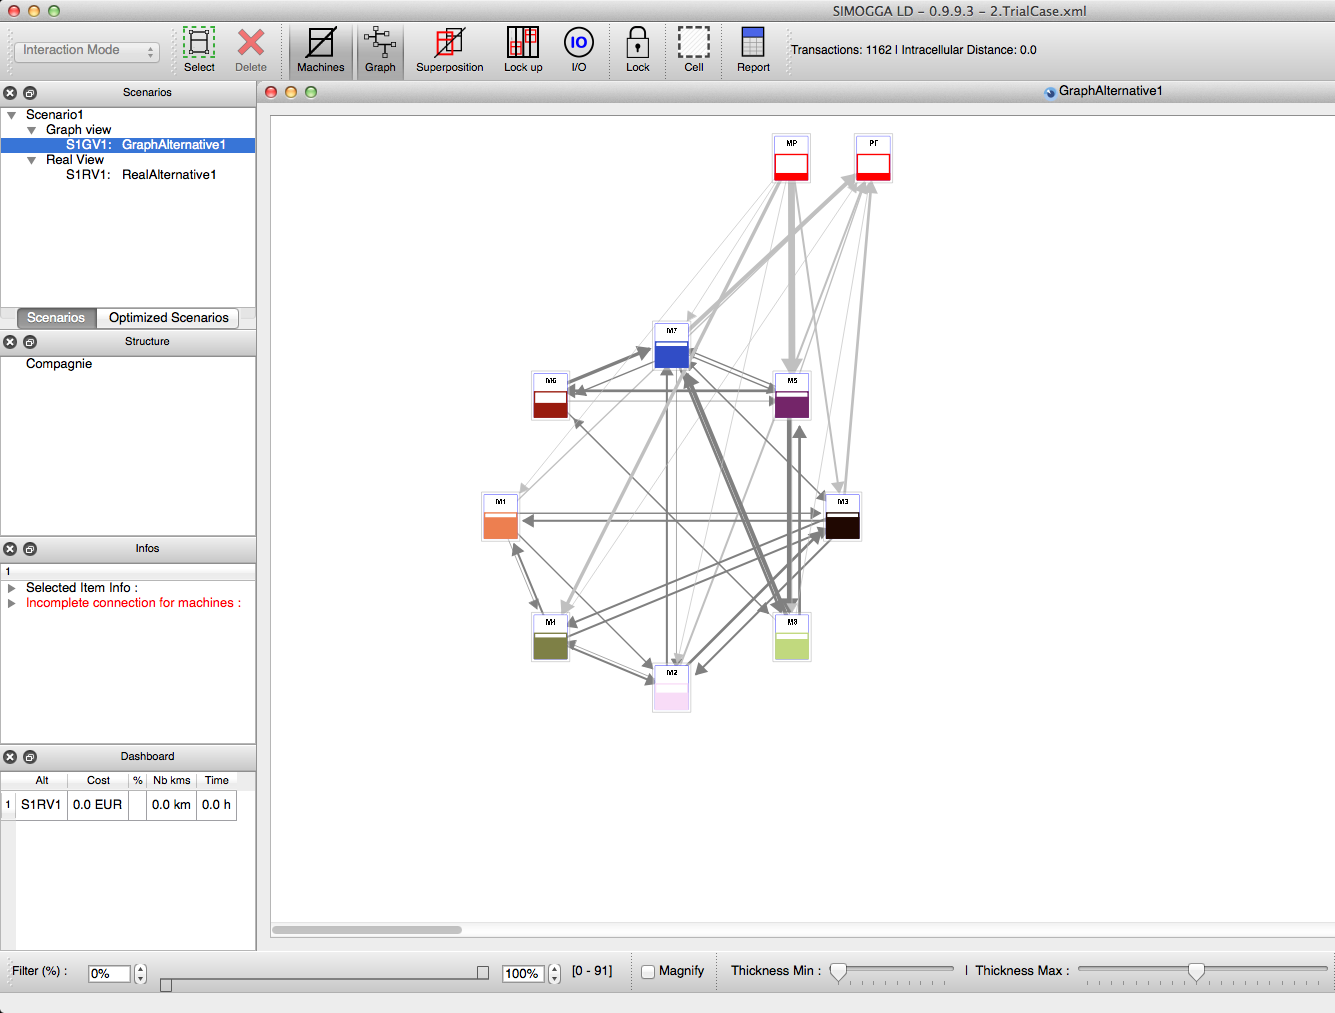
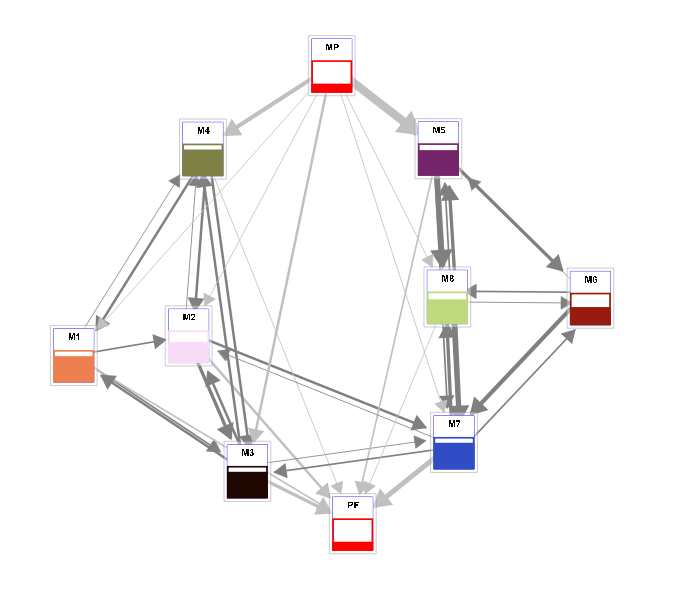
Select the alternative of the graphical view in the navigation panel.
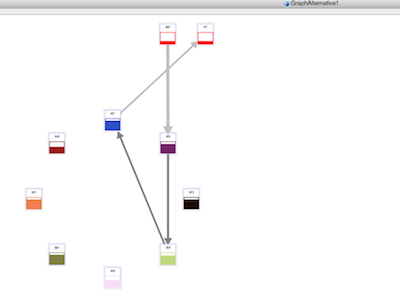
The machines are arranged in a circle so that all streams are visible. This view has many uses as described below.
Available tools
Via the main menu Option/Filter
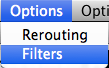
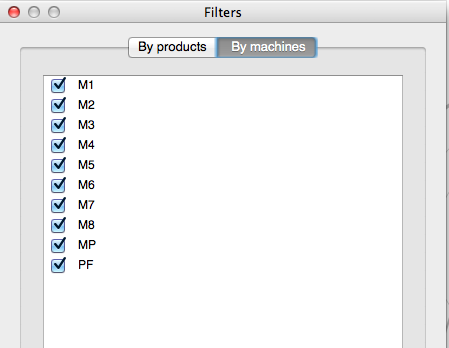
- Filters by machine: allow the analysis of those flows connected to one or more machines.
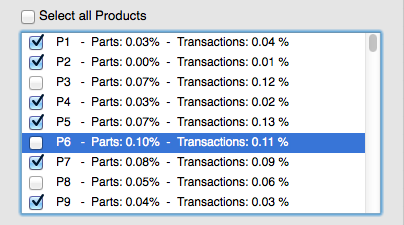
- Product filters: allow to visualize the flows of one or more products.
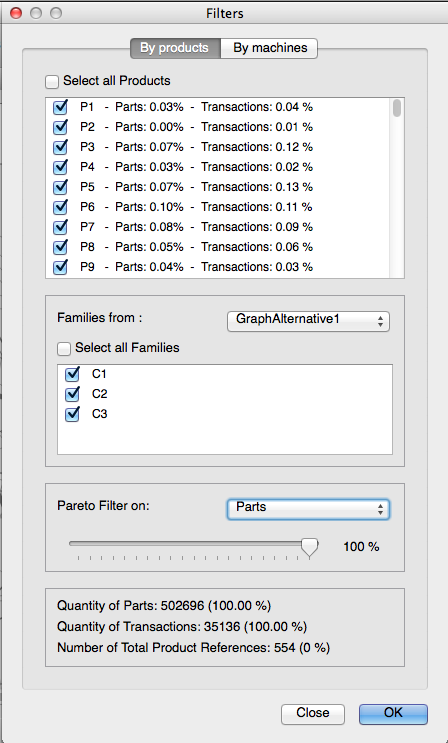
In the selection screen, each product is represented by its flow rate (in terms of quantity or transactions).
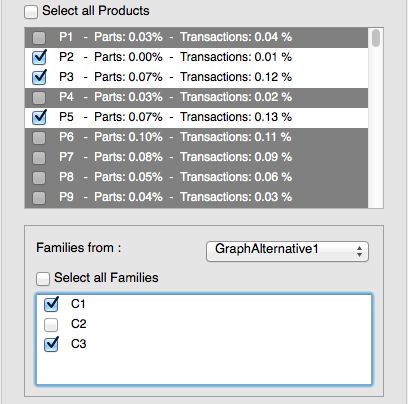
- Filters by product family: permits to visualize flows for one or more product categories when selecting a prior alternative
- Pareto filter: can be used on the quantities of goods transferred or the number of transfers made (transactions).
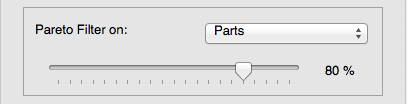
These filters will focus the analysis on some of the products All information about the filtered products are available in the below of the windows (Number of parts, number of transactions)
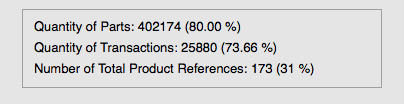
Making a flow analysis on a Pareto of products could bias the study. The tools available in SIMOGGA allow for the analysis of all the products.
Via the panel below
- A visual filter: allows to take into account all the products, but displays only the flows between a minimum value (bottom filter) and a maximum value (upper filter).

- Thickness Slider: allows to modify the thickness of the arrows representing the traffic thanks to min and max cursors.

Machines Reorganization
- Begin by placing upper filter to 100% and bottom filter to 90%. This filter allows the reorganization of the machines with the largest flows by moving them to the right of the screen.

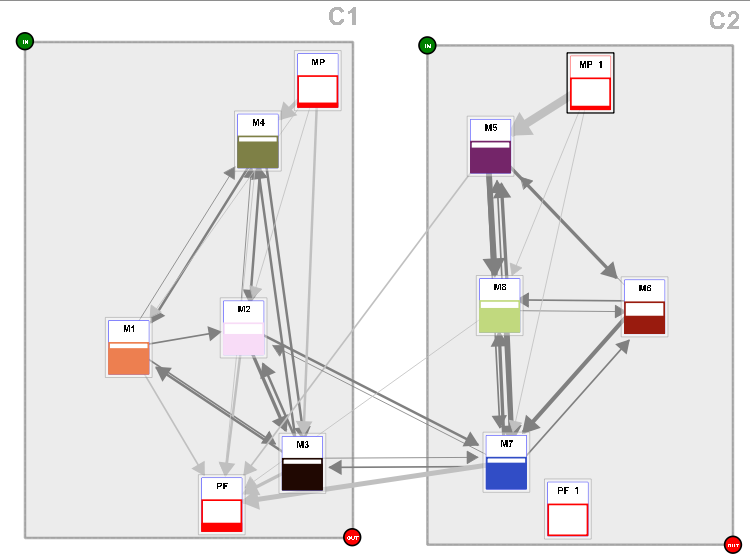
 =>
=> 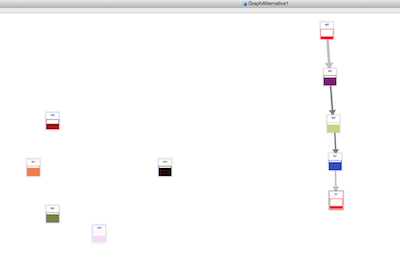
- Decrease lower filter to take more and more product flows into consideration.

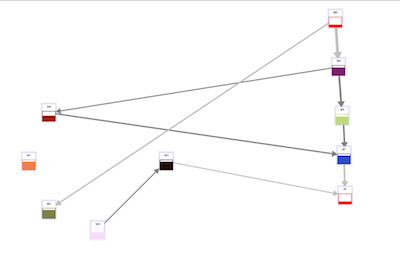 =>
=> 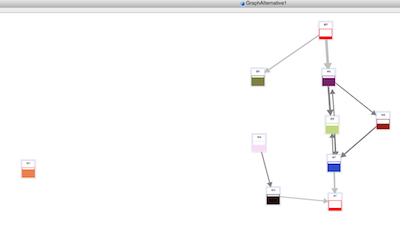
- Focus the analysis on a segment of value with a minimum and maximum value and look with a magnifying glass by checking “Magnify”. Flows will differentiate from each other.

Hint
This function is very appreciated when there are a lot of traffic in a concentrated range of values. For example, if there is some flows representing between 1 and 5000 transfers but the major part is concentrated between 1000 and 15000. The low filter is set to 1000 and the high filter to 1500. The parameter “Magnify” permit to focus the analysis to this range of values.
Rerouting
The representation of the flows gives a clear idea on machines linked together. This view doesn’t give any information about the origin of the traffic.
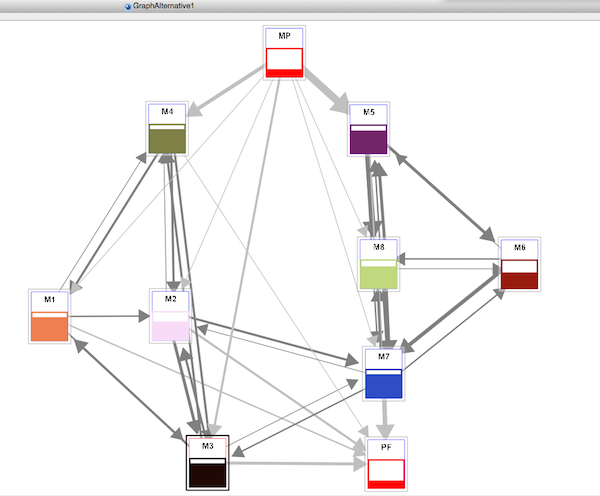
There is some traffic from machine M6 to machine M7, but we don’t know where coming from (level N-1) and where going to (level N+1).
Tool
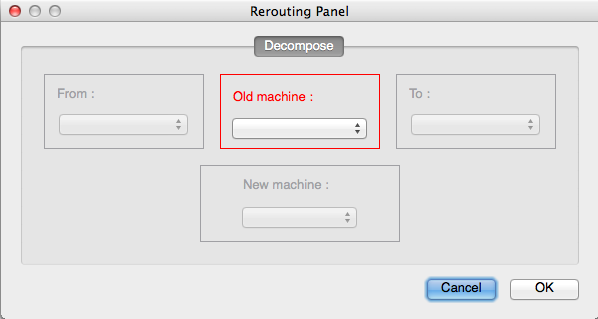
Analyzis: The rerouting tool allows us to analyse the flow in depth. A flow coming from N-1 and going to N+1 by N will be represented by N-1 -> N -> N+1. In the picture, we see the flow M6 -> M7 but we don’t konw nothing about the origin and the destination.
The rerouting tool will help differentiate these flows. The screen shows that the parts going from M6 to M7 come from machine M5 or machine M7: M5 -> M6 -> M7 et M7 -> M6 -> M7
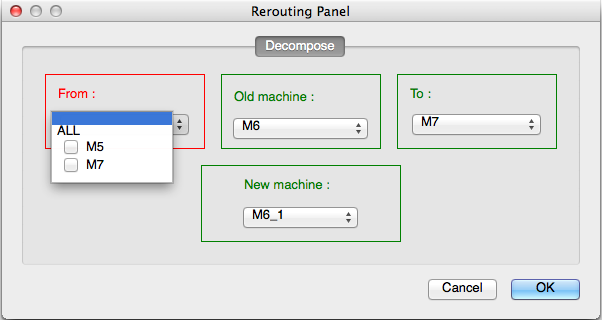
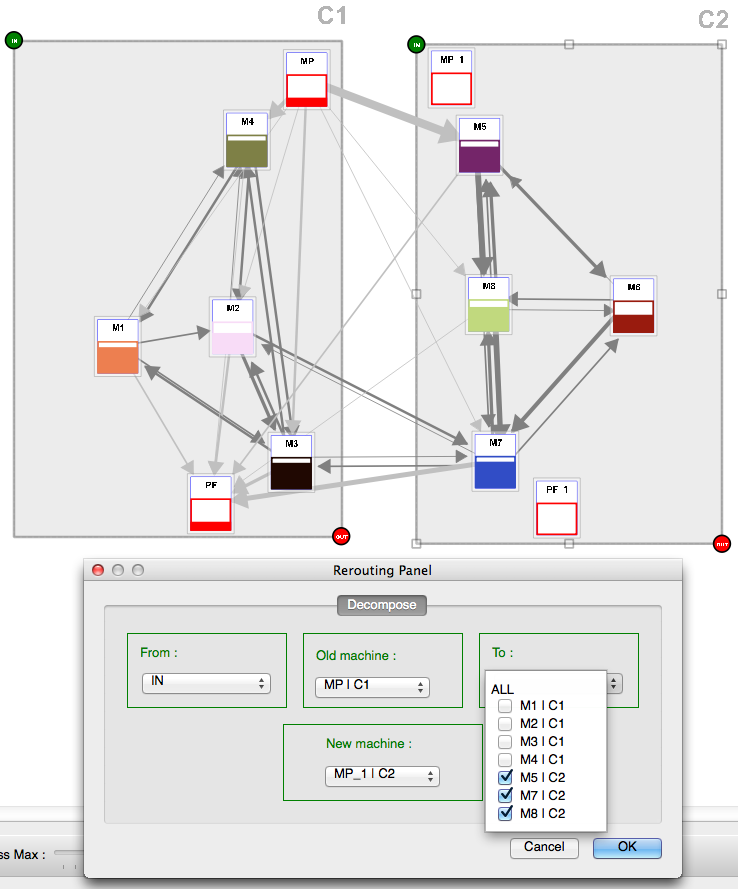
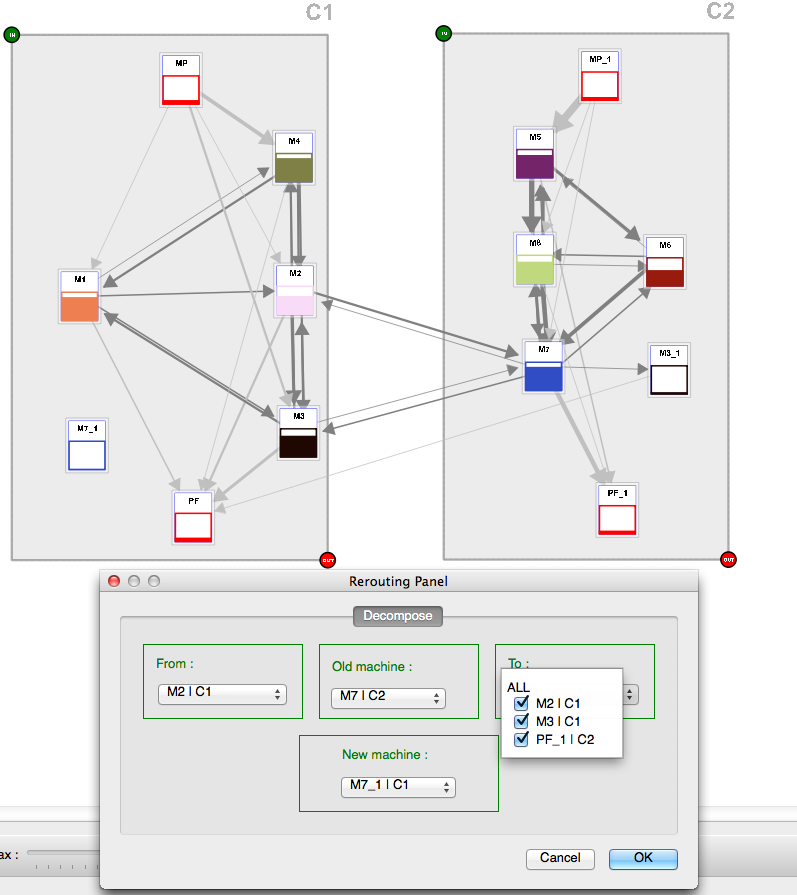
- Rerouting: This tool change the operations assigned to machine M6 to a new machine M6_1 for all the flows coming from M7 and go back to M7.
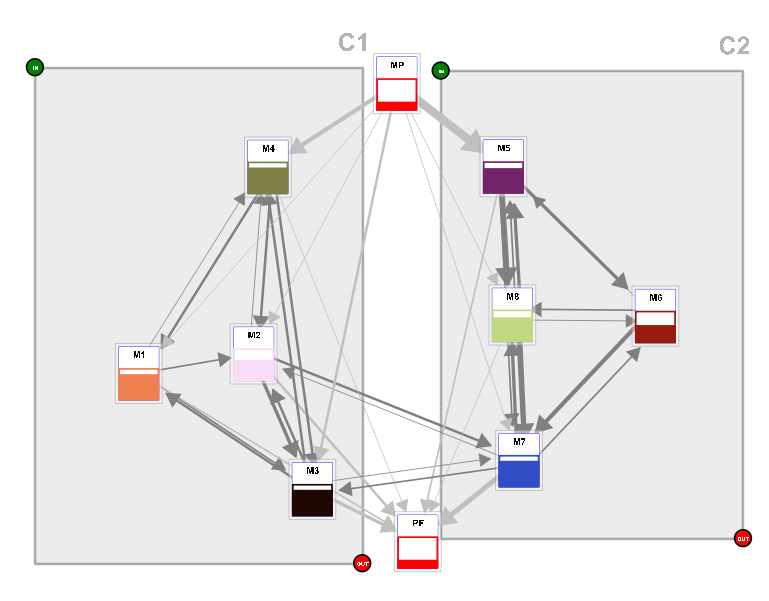
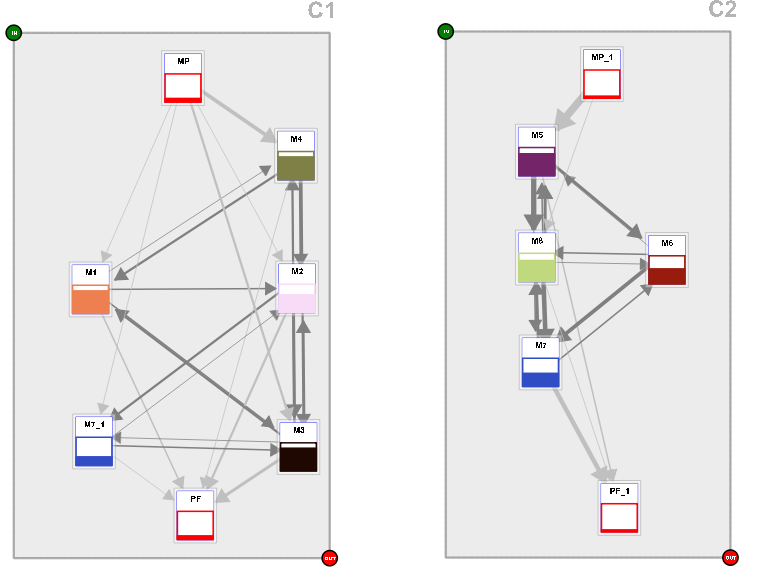
Creation of independent cells
The basis of the analysis is to manually find groups of independent machines. The objective is to break the links/the flow between the machines clusters (called cells).
Because any addition / deletion of machines or reassignment of operations to a new machine involves creating a new scenario (see prerequisites), you must first create a new scenario or duplicate an existing one. To manually create these independent groups must duplicate certain machine and reallocate certain operations on this new machine. To do this, use the “rerouting” tool.
This analysis can be lengthy depending on the number of flows and number of connected flows being analyzed. One trick is to break down the flows in a systematic manner:
Hint
In the list of proposed machine in the rerouting tool, the cell are wrotten (M5|C2). Use this information to facilitate the machine selection for the “Origin” and the “Destination”.
- Identify a main flow we want to isolate
 Define a virtual cell around machines that we want to isolate
Hint
Use the button  to unlock the machine inside the cells.
- Start by duplicating the MP (raw material). In this way, we must look at two levels of flow and not three.
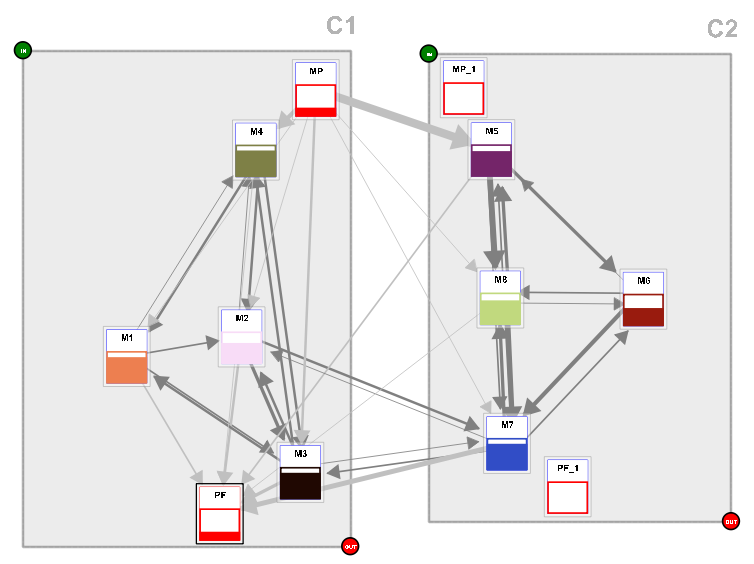
- Reassign all flows from MP that do not go to the main branch identified
- The same process for PF (finished product)
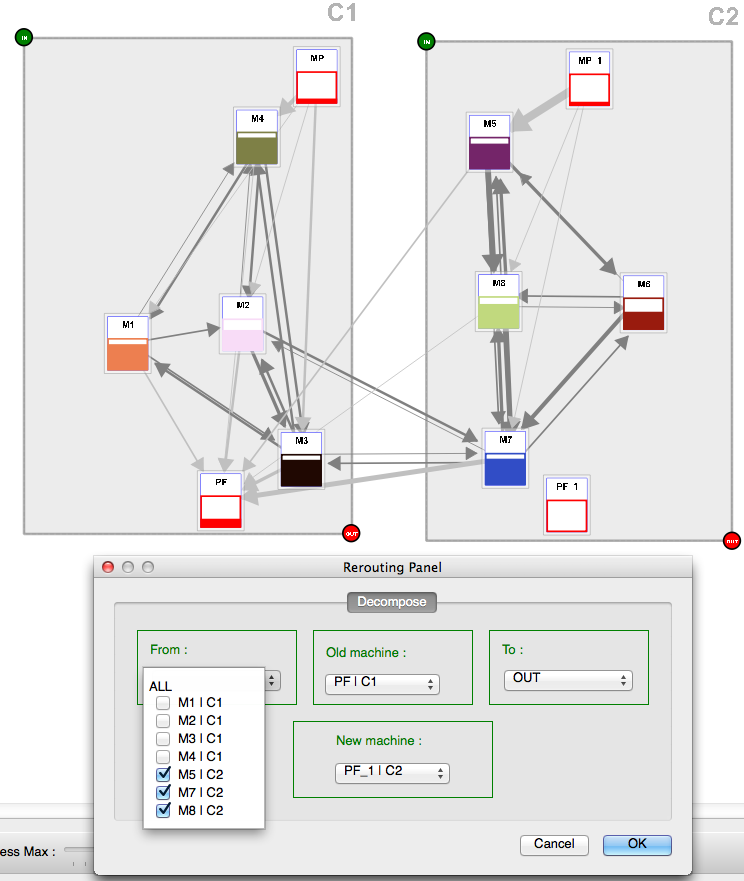
- Identify the machines that you want in the main flow, gradually isolate these machines by duplicating and reassigning all flows that do not come or do not go to the main branch identified.
- Repeat for the other branches
Creating cells automatically
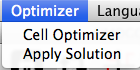
Cell optimizer
An optimization algorithm is available in SIMOGGA (main menu).
This algorithm looks for the optimal machine groupings in the scenario by assigning operations on the most suitable machines to minimize flow between cells.
- Select the baseline: machines group are those defined in the selected scenario.
- Working with the “Baseline scenario”, the algorithm can find the best solution by duplicating (1x, 2x) all machines. Only useful machines to create independent cells will be used.
- Working with another scenario, SIMOGGA look for the optimal solution with the machine defined in this scenario
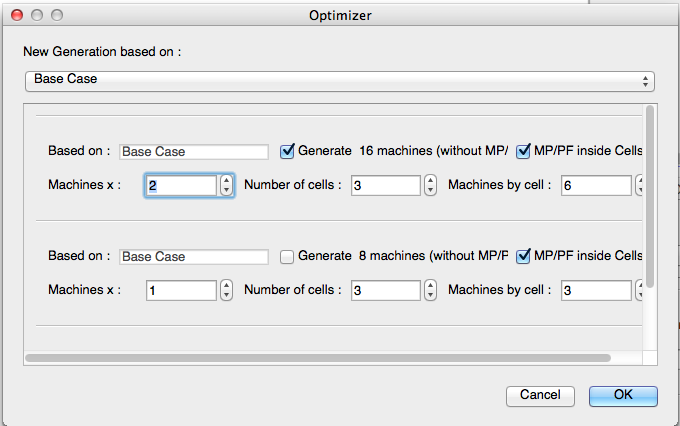
Specify the parameters
- The number of duplication of the machines (Machines x nbOccurences)
- The desired number of cells
- The cell size by a maximum number of machines
- Define if the raw material (PM) and finished products (FP) must be duplicated and inserted into cells (for a better view of the independence of cells)
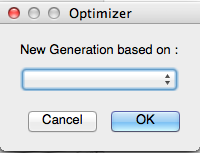
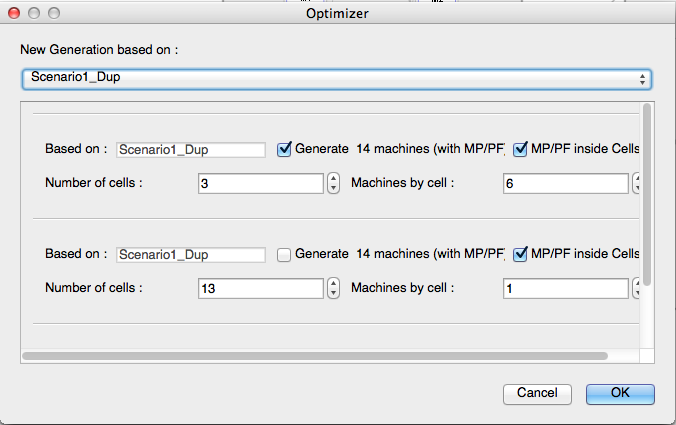
Select the cases to optimize from the suggestions (“Generate”)
Insert new cases to optimize by selecting a new scenario
The solution is presented to the screen
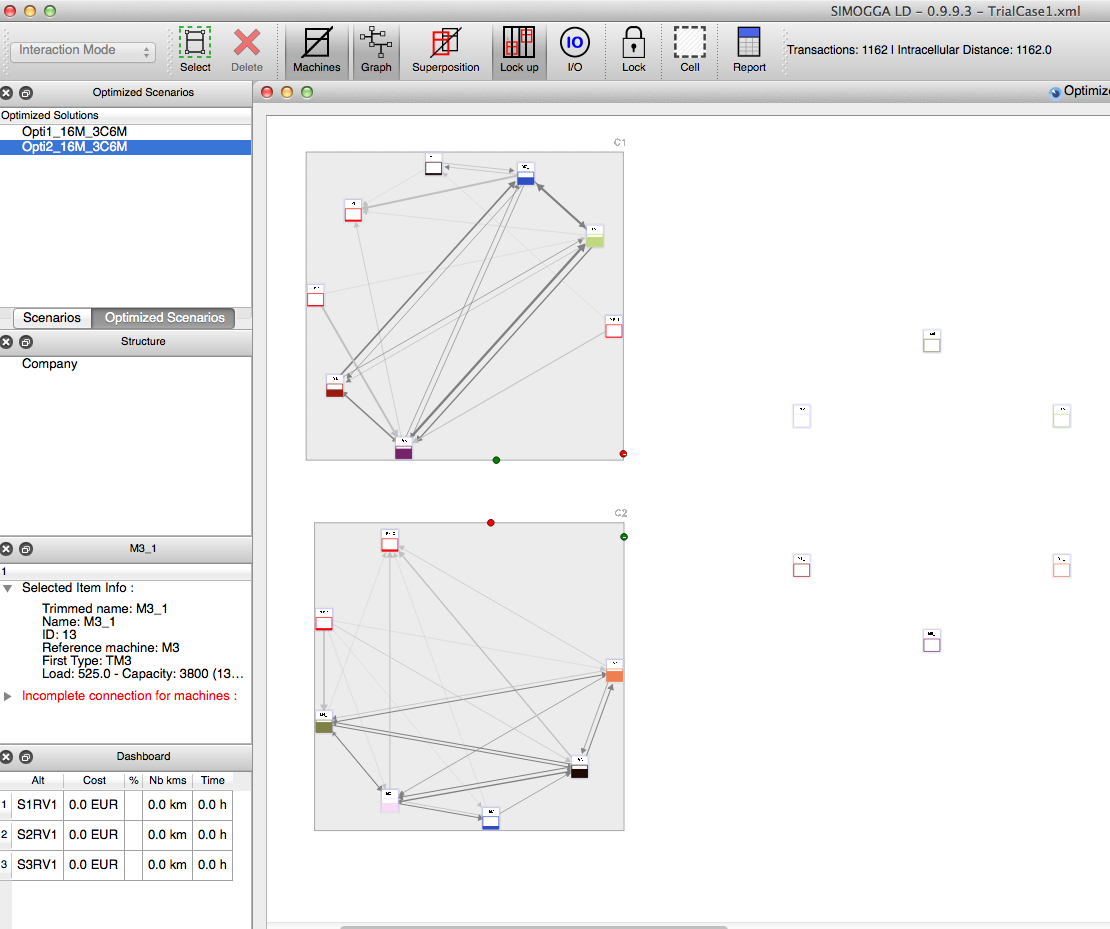
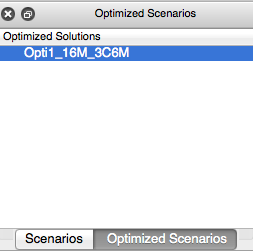
- The navigation in the optimized scenario is made by the naviation panel for the scenario
Apply the optimized scenario
- When the solutions are created, they can be applied on a scenario
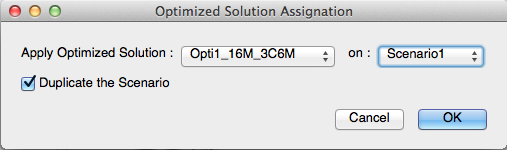
- Select the optimized solution to apply
- Select the scenario on which the solution will be applied
- Specify if the scenario must be duplicated
Hint
The cell solution is applied on the graphical view. The routing solution (operation assigned on machines) is applied to all the views of the scenario. The machines location on the real view will not be changed.
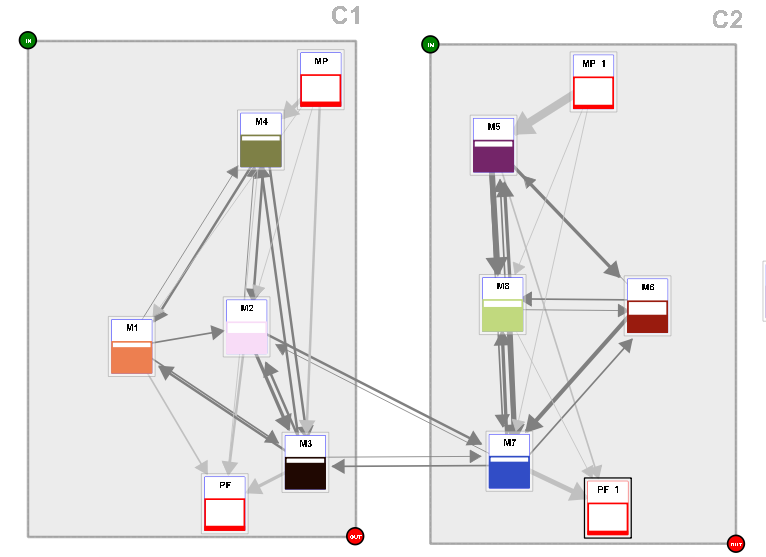
Evaluation
The creation of the cells will allow SIMOGGA to create product families assigned to these cells. The products are allocated to a cell by the number of transactions inside a cell. They are displayed in different colors (from green to red) based on the relevance of membership to the cell.
This step is useful to know the directional flow between cells that we would like to create in the real view. The intracellular flux (inside the cells) are measured and represented as a percentage of total flows.
