Handling a complete case
Opening and closing a case
Opening a case
When opening a case via the “Open” command in the “File” menu, a dialog box will appear in which it is requests if the MP (Materials) / PF (finished products)must be created if they do not already exist. Whether the response is yes, two additional machines will be created: one MP and PF finished parts. Otherwise, the raw materials MP / PF finished parts will not be present.
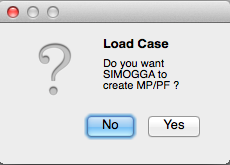
Hint
If the user loads a case that has already been saved with raw materials MP / PF finished parts, they will appear even if the user chooses not to create them. As it has already been created previously, they are now part of machines covered by this case.
If SIMOGGA fails to load the selected XML file, an error window will appear to inform to the user. For SIMOGGA to able to load an xml file, the structure of it should be the structure set up by SIMOGGA.
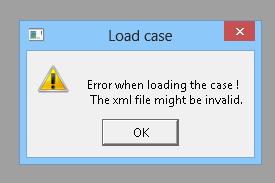
Check that the xml file does not contain special characters such as:
- #DIV/0!
- #N/A
- #VALEUR!
- /
- *
- ‘
- ( or )
- &
Saving a case
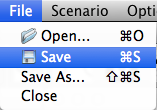
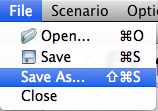
Two types of save options can be found in the “File” menu:
- Save: The backup will be done on the open file. The changes will be saved in the same xml file.
- Save As … : The user can choose the backup location and name of the saved file.
Closing a case
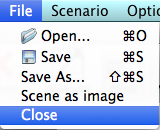
When closing a case using the command “Close” from the “File” menu, it will ask the user if he wants to first save the changes it has made.
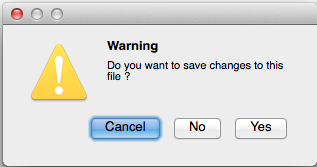
If the answer is yes, the case treated saved in the same xml file. Otherwise, changes made since the load cases will be lost.
Creating the baseline
Creating a factory - Design mode
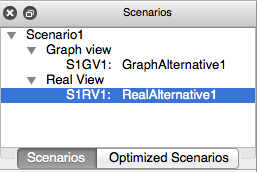
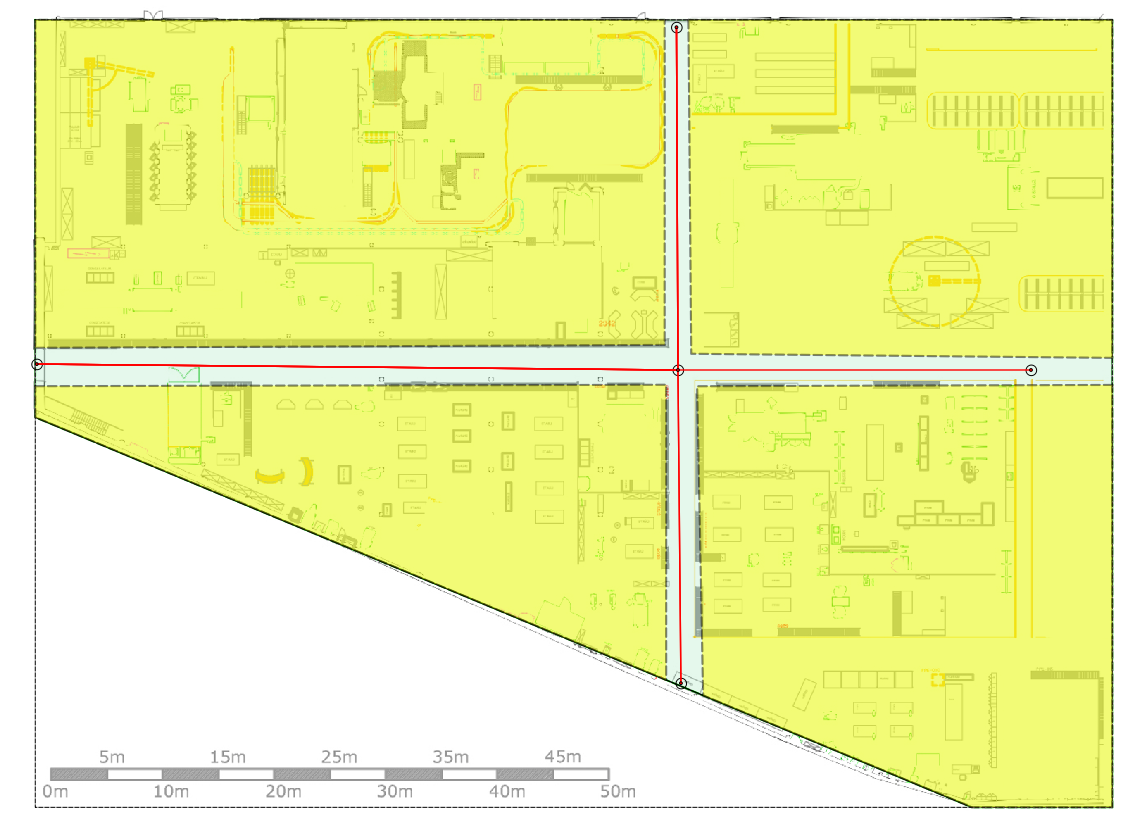
In the real view, it is possible to obtain a two-dimensional representation of the work area corresponding to the reality.
- Select a real alternative by clicking on the alternative in the scenario menu
- Switching to Design mode

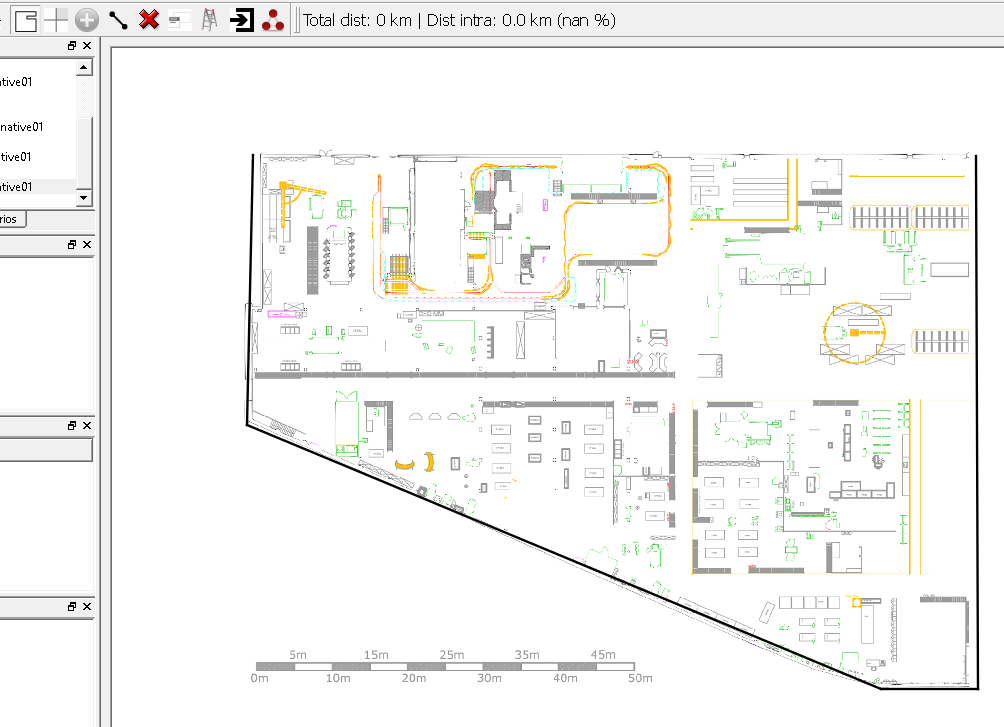
- Select a background image corresponding to the plant layout (png or jpeg) via the button

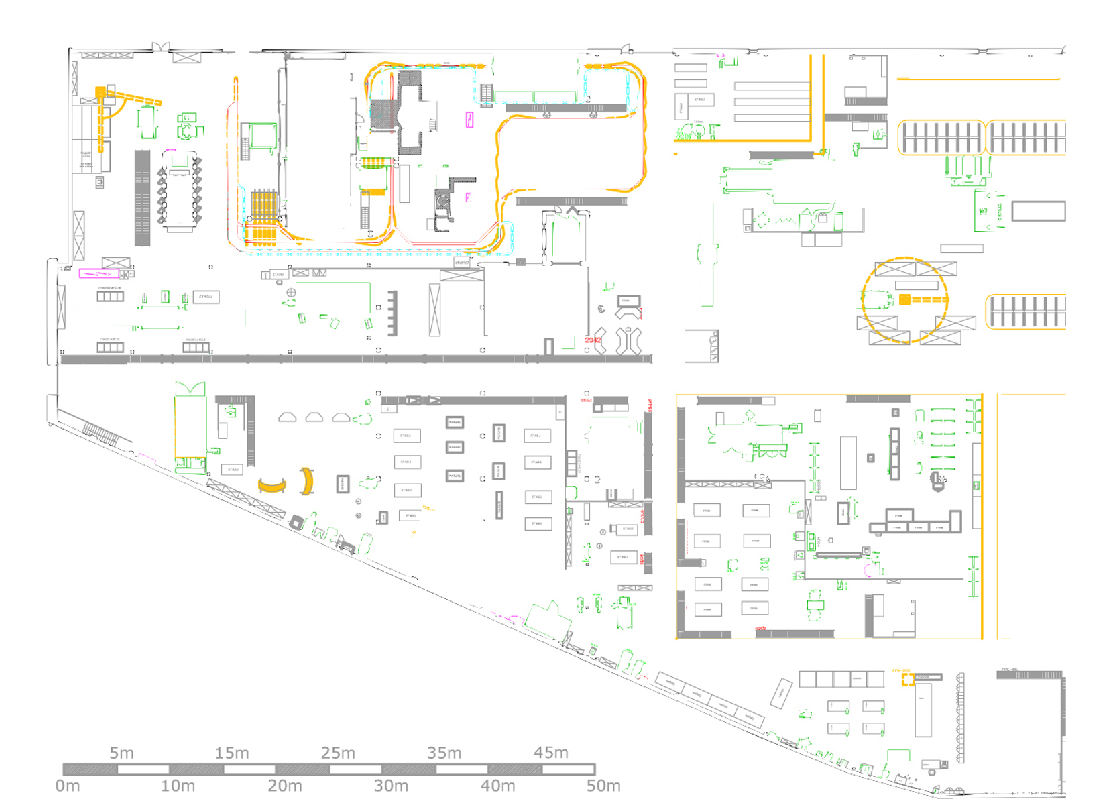
Determine the contours of the plant
- Info : Sidebar navigation
- Click on the icon

- Create the outline by simple successive clicks on the corners of the map. Every click is a point on the polygon representing the outline.
- End with a double-click (on the penultimate point) to indicate that the polygon is complete and it will close automatically.
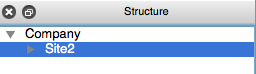
- Choose the type of desired zone (site, building, floor, area)
- Rename the area
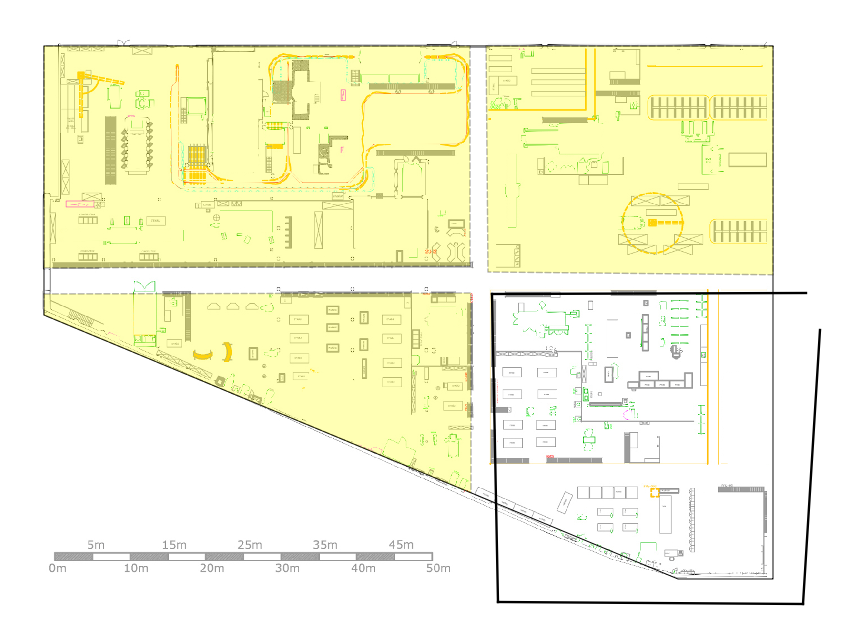
Identify sub-areas, if necessary
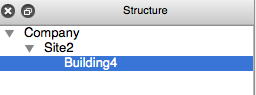
- Select the parent zone via a click on the area at the scene or at the navigation menu in the structure.
- Click on the icon
- Create the outline by simple successive clicks on the corners of the map. Every click is a point on the polygon representing the outline.
- End with a double-click (on the penultimate point) to indicate that the polygon is complete and it will close automatically.
- Choose the type of desired zone (site, building, floor, area)
- Rename the area
- Automatic truncation of the new area relative to the parent zone. It is therefore not necessary to be precise in the drawing at the boundaries of the parent zone.
Identify work areas where machines may be placed.
Hint
a work area may have the “parent” any area previously defined (site, building, floor, area)
- Select the parent zone via a click on the area at the scene or at the navigation menu in the structure.
- Click on the icon
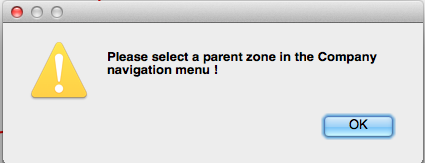
- If the parent zone is not selected, a warning message appears. We must then select the parent in the side navigation menu. The scene is not accessible until the button
is pressed.
- Create a polygon using a series of mouse clicks
- Finish with a double click to mark the automatic closing of the polygon
- If the polygon created exceeds the area in which it is located, it will be truncated to fit the contour.
To scale
- Click on the button

- Use a distance that is defined on the plan.
- Click (single click) on the two points defining the distance.
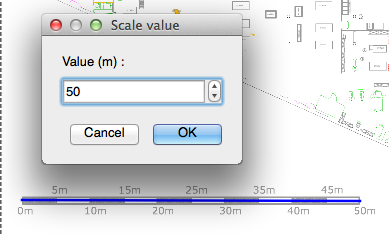
- Set the distance in meters
- Click OK
- Click on the button
Create the skeleton of aisles
The skeleton is the graphical of view the aisles of the factory through which will pass the traffic between the work areas (intercellular traffic). This tool is available in “design mode” of the real alternative.
Select the area where you want to put aisles using the scene or the navigation menu
Click the icon

Insert the junction of aisles with double clicks.
SIMOGGA automatically connects the points if:
- The line does not cross working areas
- line does not go too near the corners of working areas.
- The lines are not too close.
Add lines manually
- Activate the button

- Double click on two points to connect
- Activate the button
Remove unwanted lines
- Select the element to be deleted
- Choose several elements holding down the Ctrl / Cmd keys
- Click on the button

- Click OK
It is also possible to generate the skeleton fully automated manner using the “create automatic skeleton” button on the toolbar. If this option is chosen, SIMOGGA attempt to generate a skeleton covering all the intercell areas.
Add inputs and outputs (IO points) on the edge of an area.
- Activate the button

- Double click the edge of the area.
- Right-click the item added to change its type
- IN :Only inflows can pass
- OUT : Only outflows can pass
- I/O : All the flows can pass.
- Activate the button
Hint
IO points will be helpful if you find yourself facing a factory with multiple floors and / or buildings, or if one wishes to work on several sites simultaneously.
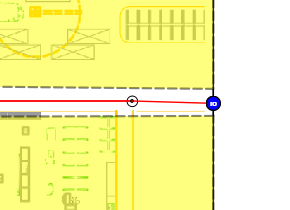
Set a distance on a skeleton line.
Hint
This will be particularly useful when you want to work with multiple sites simultaneously, a single skeleton line maybe set in meters or kilometers.
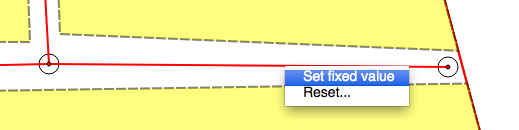
- Right click on the line to set
- Select “Set the distance”
- Enter a value in meters or kilometers
- Right-click the line to display the entered value
- Delete the value via the “Reset” option
Machine Placement - Interaction Mode
When work areas (yellow) were created in design mode, machines can be placed. To do this, a simply “drag & drop” the machines. We can therefore represent the initial situation in which the plant is located.
Different type of views are available
- standard : Machines are connected directly if they belong to the same area, if not traffic is through the aisles

- By the aisles only : All traffic via the aisles.

- As the bird flies :the aisle backbone is not used. The machines are connected via directional flow.

In the first two displays, the concept of direction disappears. It is all the traffic that is shown on each segment. This type of view mode is only possible if an aisle skeleton was built in design mode. Otherwise, the representation is as the crow flies.
The machines can be modified by:
- The position with “drag & drop”.
- Their size to represent more accurately the real place that takes the machine within the factory:
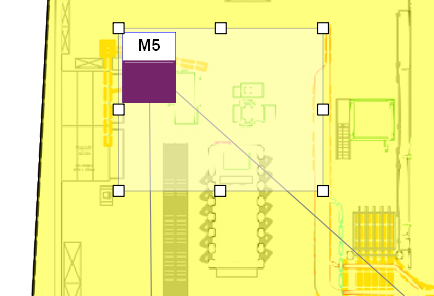
- Select the machine
- Display of the squares on the contour
- Move the squares of a contour
- leur orientation :
- Click on the “Rotation” button
- Double click on the machine.

Immobilisation. A locked machine canot be moved:
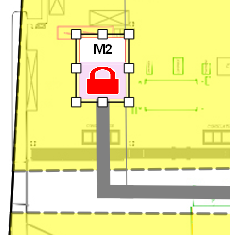
- Click on the button

- Double click on the machine.
- The lock is displayed on the machine.
- Click on the button
Flow analysis in the graphical view
The graphical view provides a representation of machines and directional flow (traffic) that pass between them without taking into account the design of the plant, the technical, historical or cultural.
This view allows the representation of the spaghetti diagram, a set of interlocking flows. Various tools are available to analyze these flows.
The objective of this analysis is to highlight the product families including main stream, isolating and creating groups of machines (cells) autographed with these flows.
This process takes place in two steps.
1 Reorganization machines to clear the various lines of flux.
2 Duplication and reassignment to approach a “lean” solution.
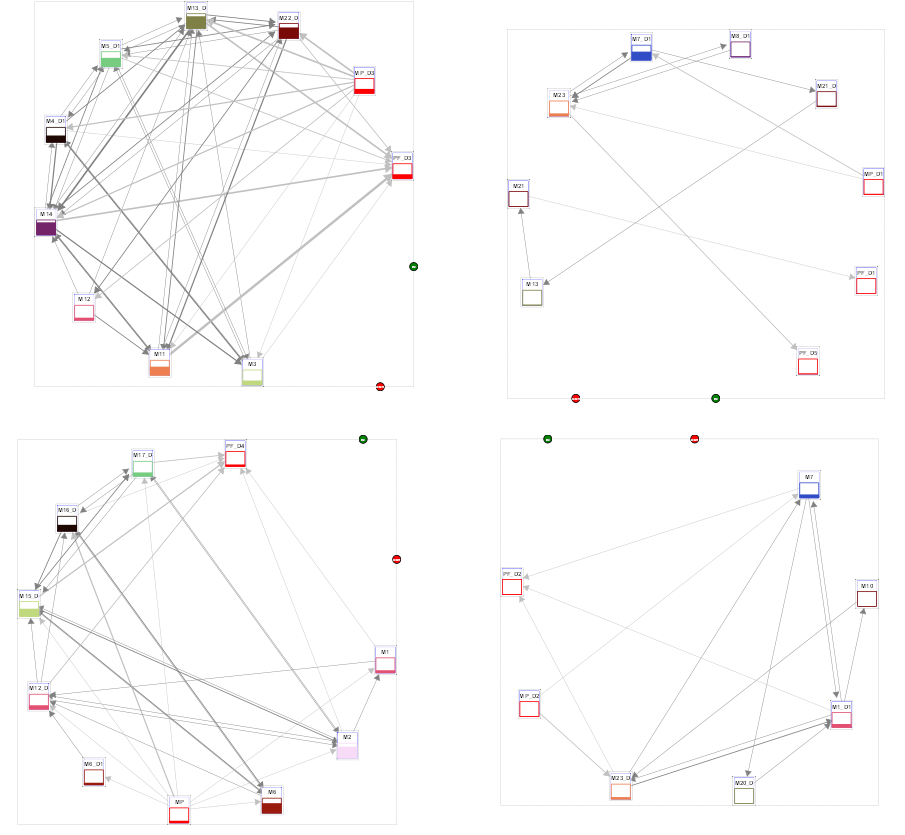
When Loaded, the graphical view shows the machines arranged in several successive circles. In general, it will not be easy to distinguish precisely how the flows are organized.
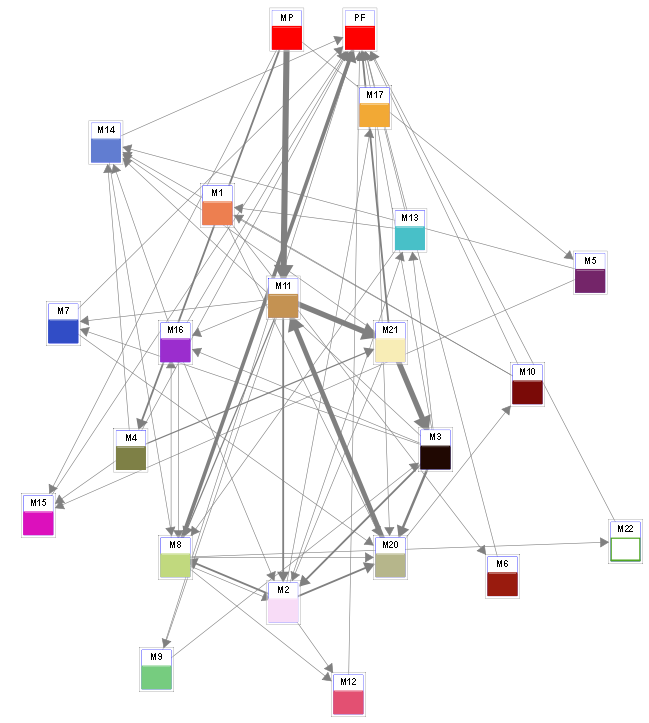
It will therefore be necessary to use the tools made available to the user to organize the flow of more visually. To do this, it will be possible:
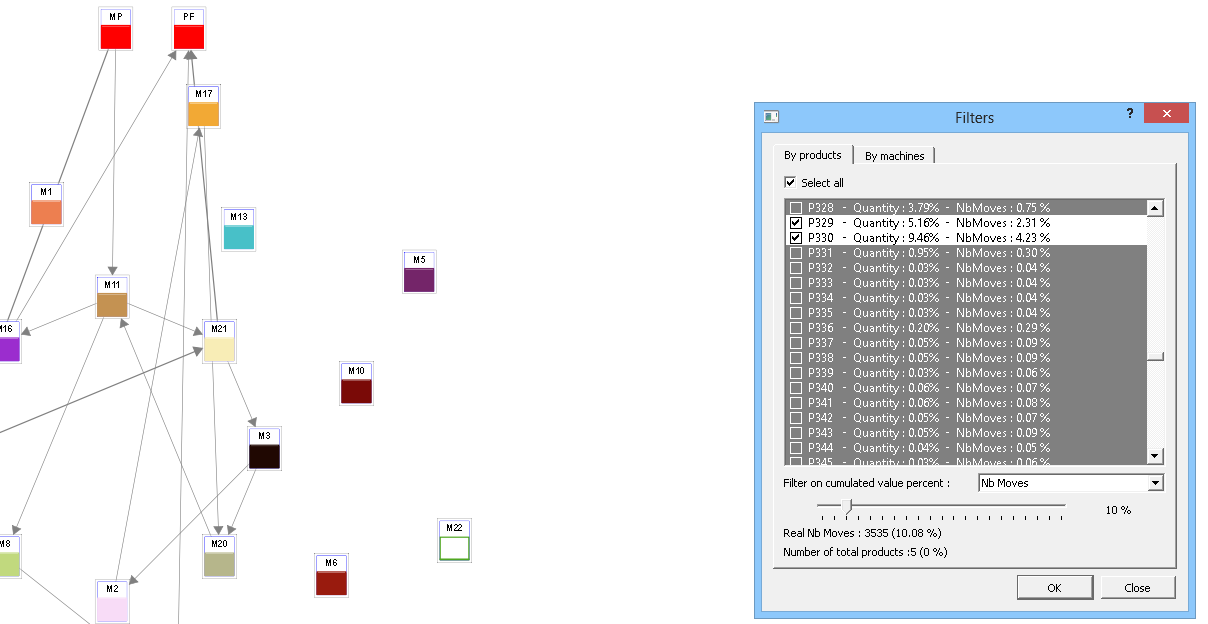
- To use the filters to overshadow the smaller flow through the filter panel at the bottom of the screen

- Use the product filters :
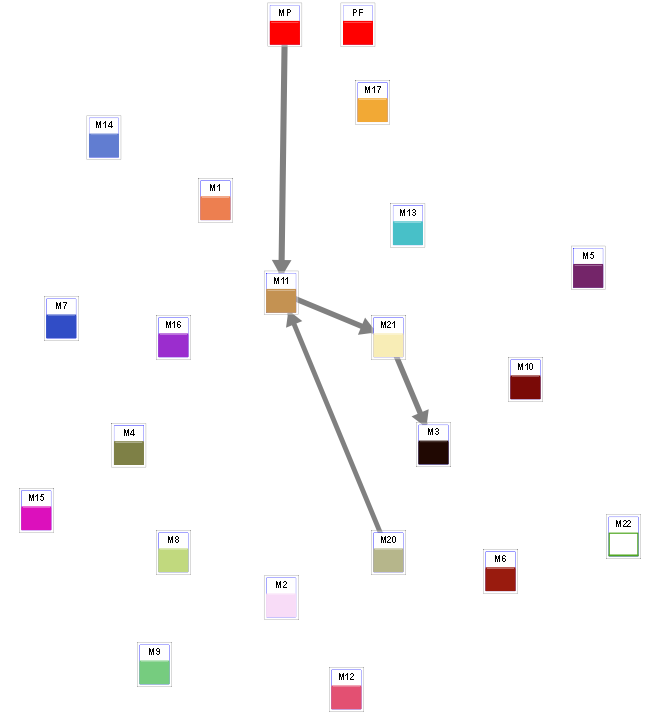
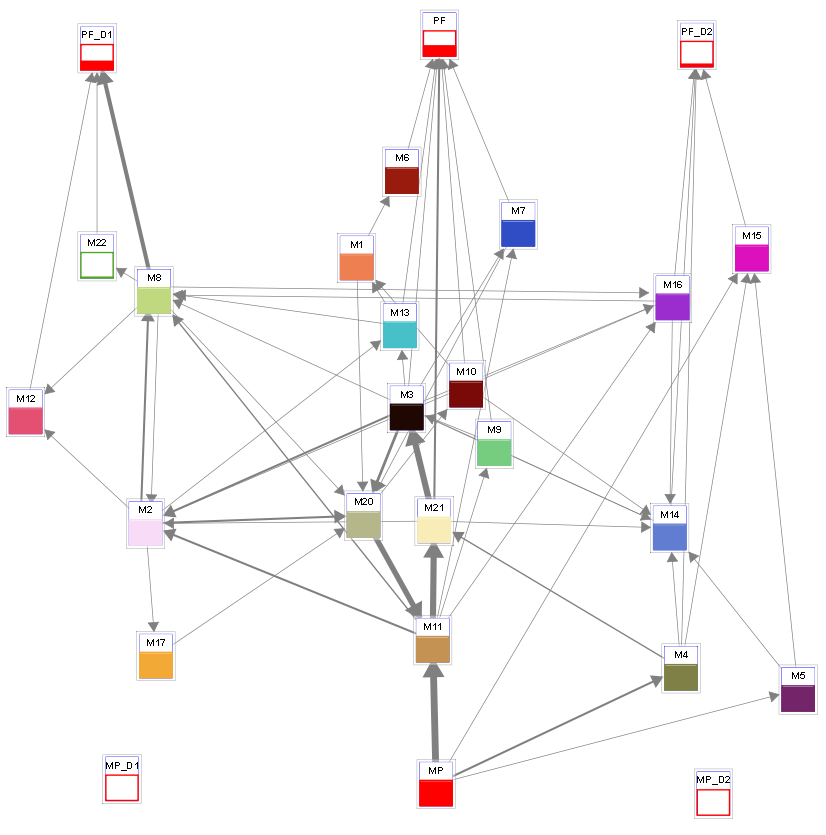
It will then be possible to manage that part of the machine and to gradually flows appear smaller. In the end, after reorganizing the position of each machine, a more meaningful picture of the situation of flux is obtained
In the picture above, we can clearly distinguish a central vertical axis. However, a plurality of cross flow yet come this axis remains complicated and determine potential product families. It is the object of the second step to duplicate some machines and reassign flow thereon.
Duplication and reassignment
Tools to use:
- Filter graph
- Product Filters
- Thickness of flux
- Control rerouting
To duplicate machines, you will first create a new scenario based on the one we just discussed. Once done, it is possible, via a right click, duplicate each machine.
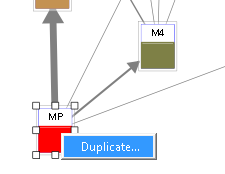
Once a machine has been duplicated, it will be possible via the control flow reassignment, change flows through this machine.
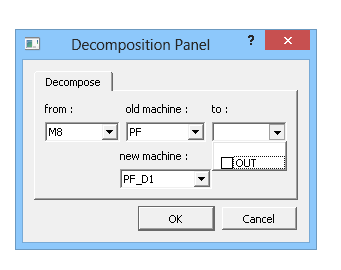
By selecting the old machine, the new machine, and both machines through which flows come and go, it is possible to change the path for these flows pass through the newly selected machine.
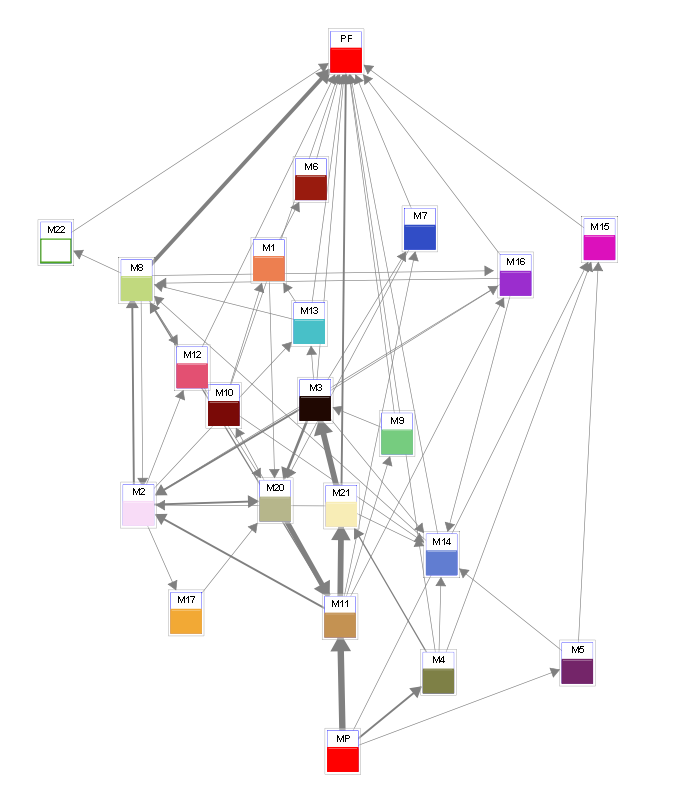
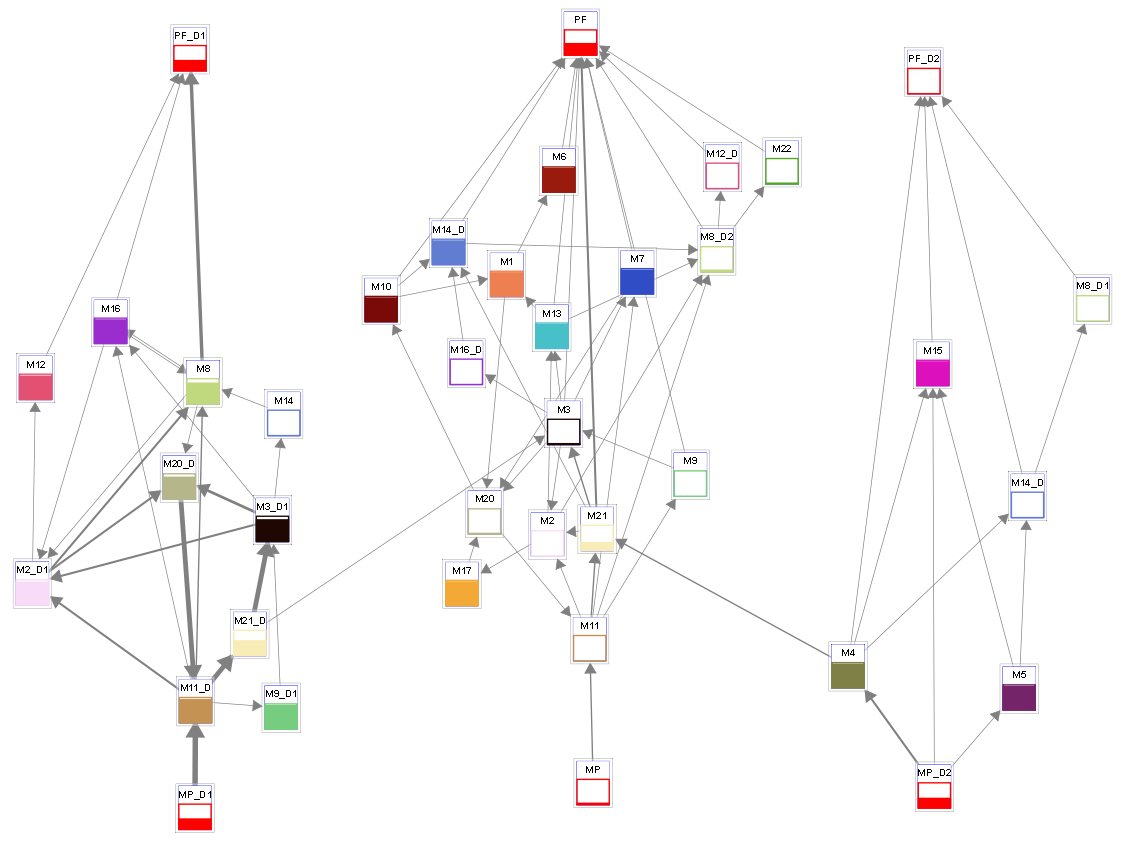
Initially, it is interesting to focus on the MP (raw materials) / FP (finished products) to identify several potential axes. In the example below, they were both duplicated 2x.
It can therefore be noted that the trend is towards three vertical axes. However, many still flows through these axes horizontally. The next step will then duplicate machines comprising most of these flows. In the example below, the machines 8 and 14 were duplicated. We note that, quickly, the right axis has become almost completely independent of the other two. As against, the left axis and the central axis are mixed too.
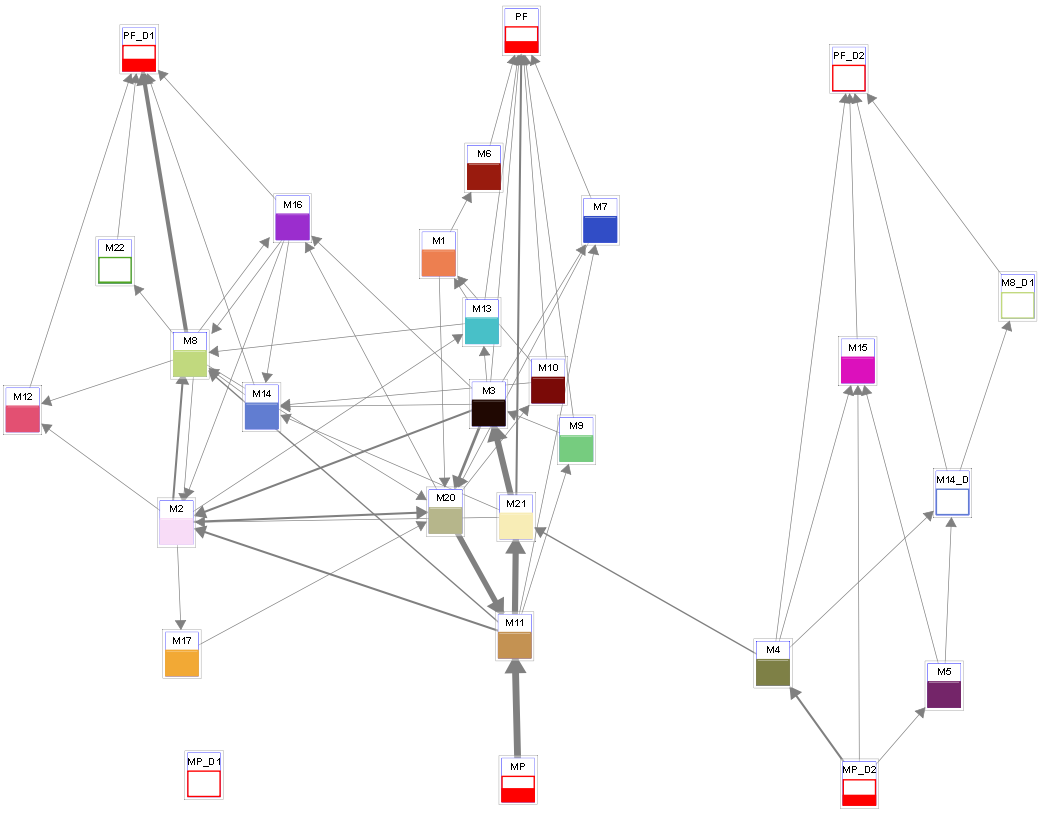
By duplicating more additional machinery is nevertheless happens to isolate these two parts of almost complete manner.
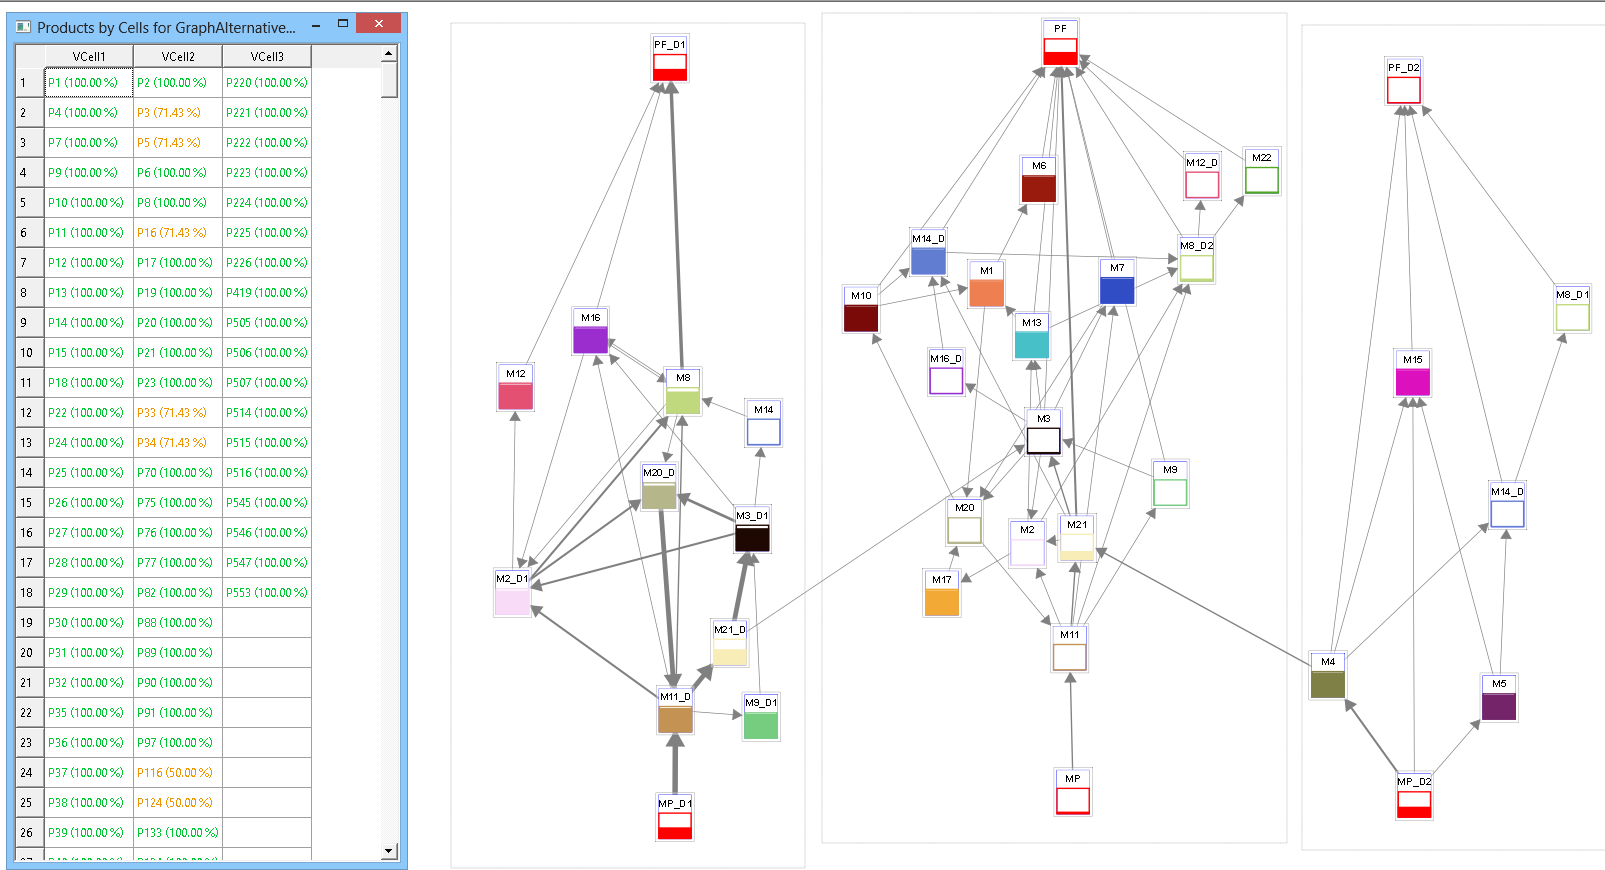
We now decomposed streams to obtain three separate axes.
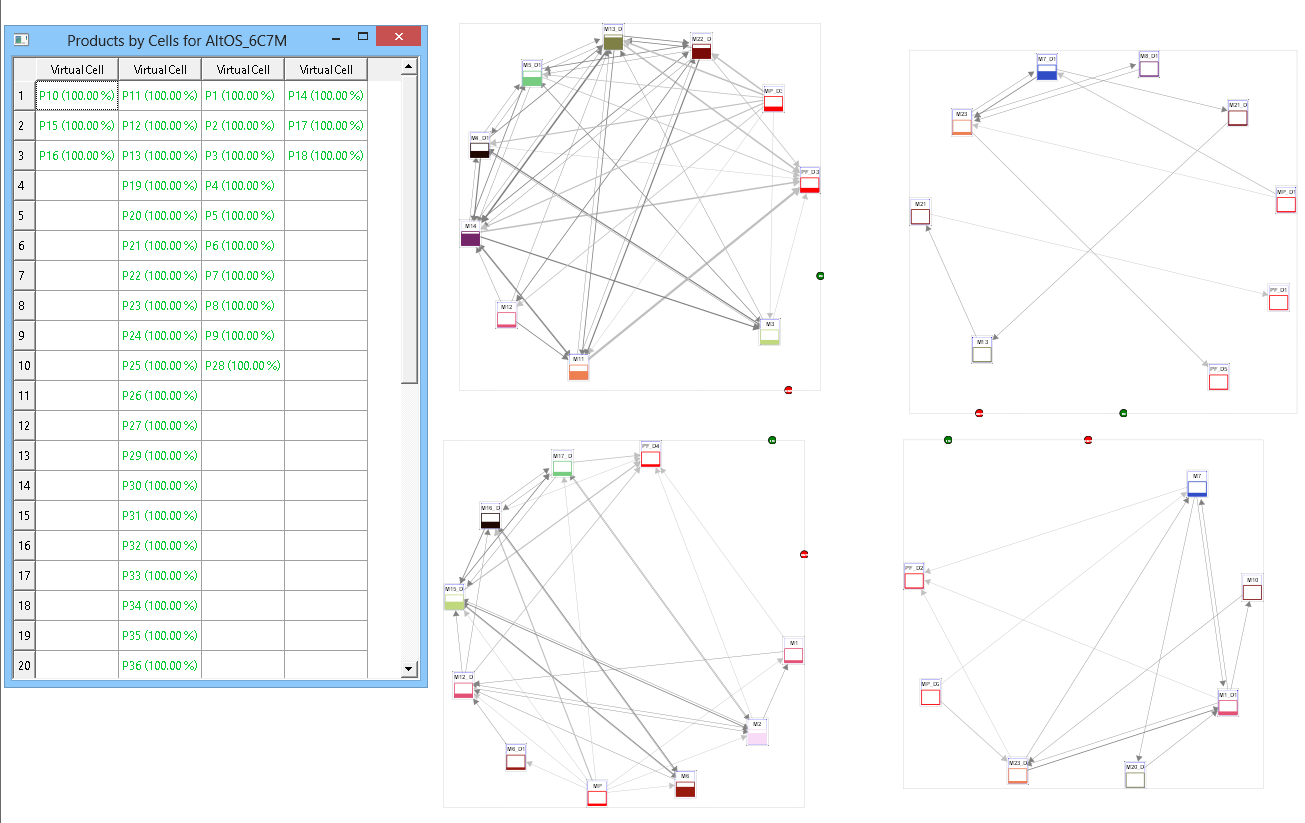
 It is now possible to create “product families” surrounding each axis using a virtual cell.
 Once done, you can see a table of products by cells in order to identify product families created.
Setting cells
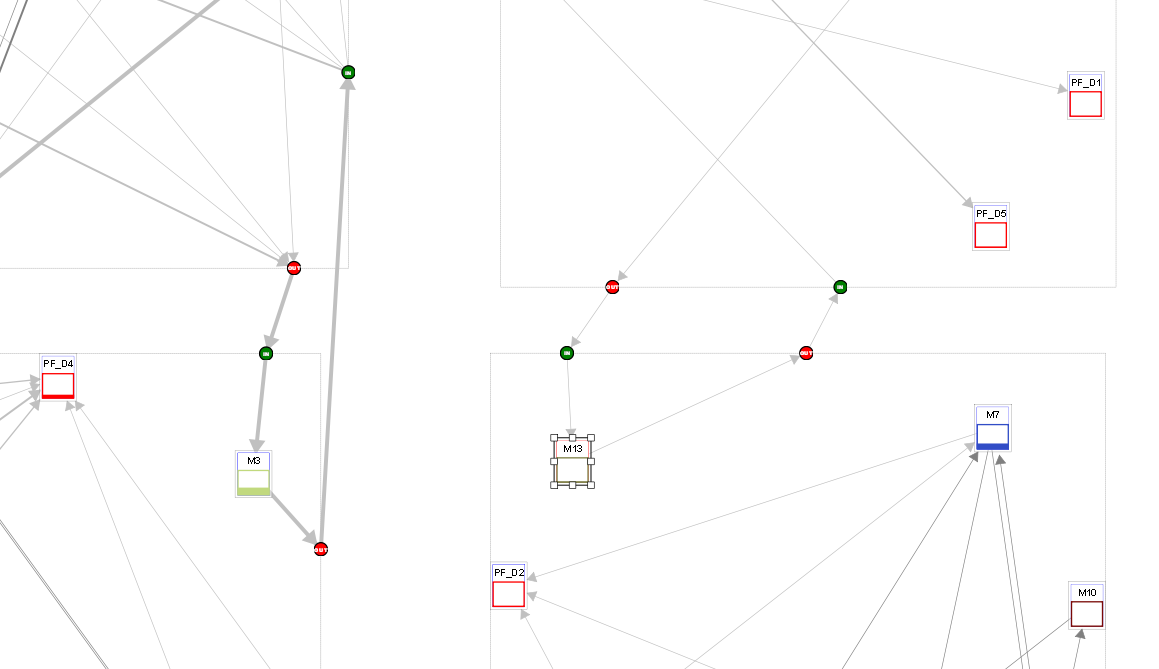
The cell allows for a representation of the flow cell. Unlike virtual cells that can be created in the graphical view, cells this time point / O through which pass the intercellular flow. When using RRPCMGGA to create optimized solutions, cells that will be viewed will be generated. In an ideal situation, all flows should be intracellular, as in the example below
However, in most cases, a portion of this stream will intercellular. As said before, they will go through the IN / OUT points. It is possible to freely move the points on the contour of the cell, as it is also possible to modify the size of the cell. Machines that are in it will move automatically to stay on the circle they form. The minimum cell size is defined by the circle that contains the machines. The machines can overlap, it will be impossible to reduce further the size of the cell if the machines are located inside collide.
The user may at any time moving the machines but are, by default, locked within their cell. Nevertheless, it is possible to remove this limitation by enabling the “lock / unlock machines” from the toolbar. Finally, the user can, as in graphical view, access the table produced by cells.
Creation of Scenarios
How to use scenarios and alternatives
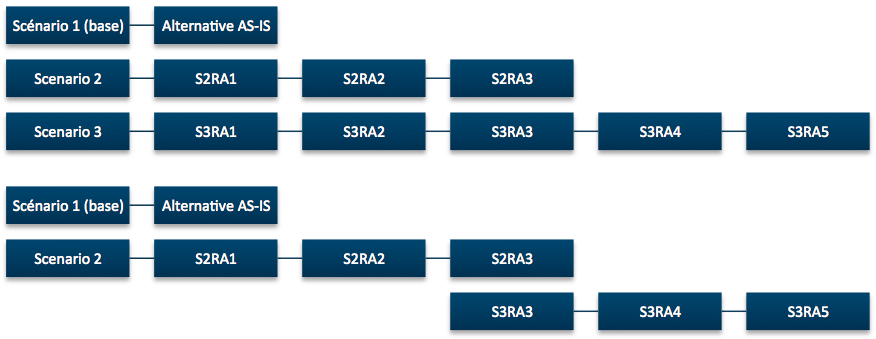
To create solutions based on the reassignment of flows performed in the graphical view of the “Scenario 2”:
- Work on Scenario 2 alternative “S2RA1”
- Determine incremental changes (in terms of positioning of machines):
- Edit “S2RA1”
- Duplicate “S2RA1” to “S2RA2”
- Edit “S2RA2”
- Duplicate “S2RA2” to “S2RA3”
- Edit “S2RA3”
..hint each state is to be saved must be duplicated to keep the changes. * Modify the design of the plant * Duplicate Scenario 2 (Scenario 3 =) * Modify the design (delete cells, create new cells …) * Remove non useful alternatives previous Scenario 2 (“S2RA1” and “S2RA2”) * Begin to change the alternative “S3RA3” (new design with machines positioned as the last alternative scenario 2) * Proceed with incremental changes to create different alternative “S3RA3”, “S3RA4” to “S3RA5”
Incremental changes (via alternatives) can result in the release of a box and then redesign of this area (via a new scenario).
Using the Dashboard
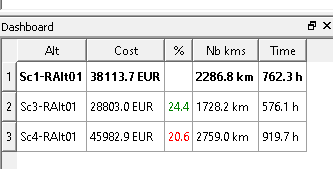
The dashboard allows you to compare different real alternatives to quickly and easily visualize which is the best of them. It contains several data:
- The name of the alternative and it’s scenario .
- Total cost that represents the situation
- The percentage gain this situation than that indicated as the reference
- The total number of kilometers traveled by products
- The total time
To determine what is the alternative reference, you either go through the Scenario menu, or right-click on the selected alternative and choose “set as baseline” option. Computing the winning percentage of alternatives will be based on this alternative reference.