Planner - Results
Analyzing the results
For each schedule an individual tab appears displaying all the information needed to analyse this schedule but there is also a “Summary” tab allowing the comparison between the different schedules.
The Gantt chart
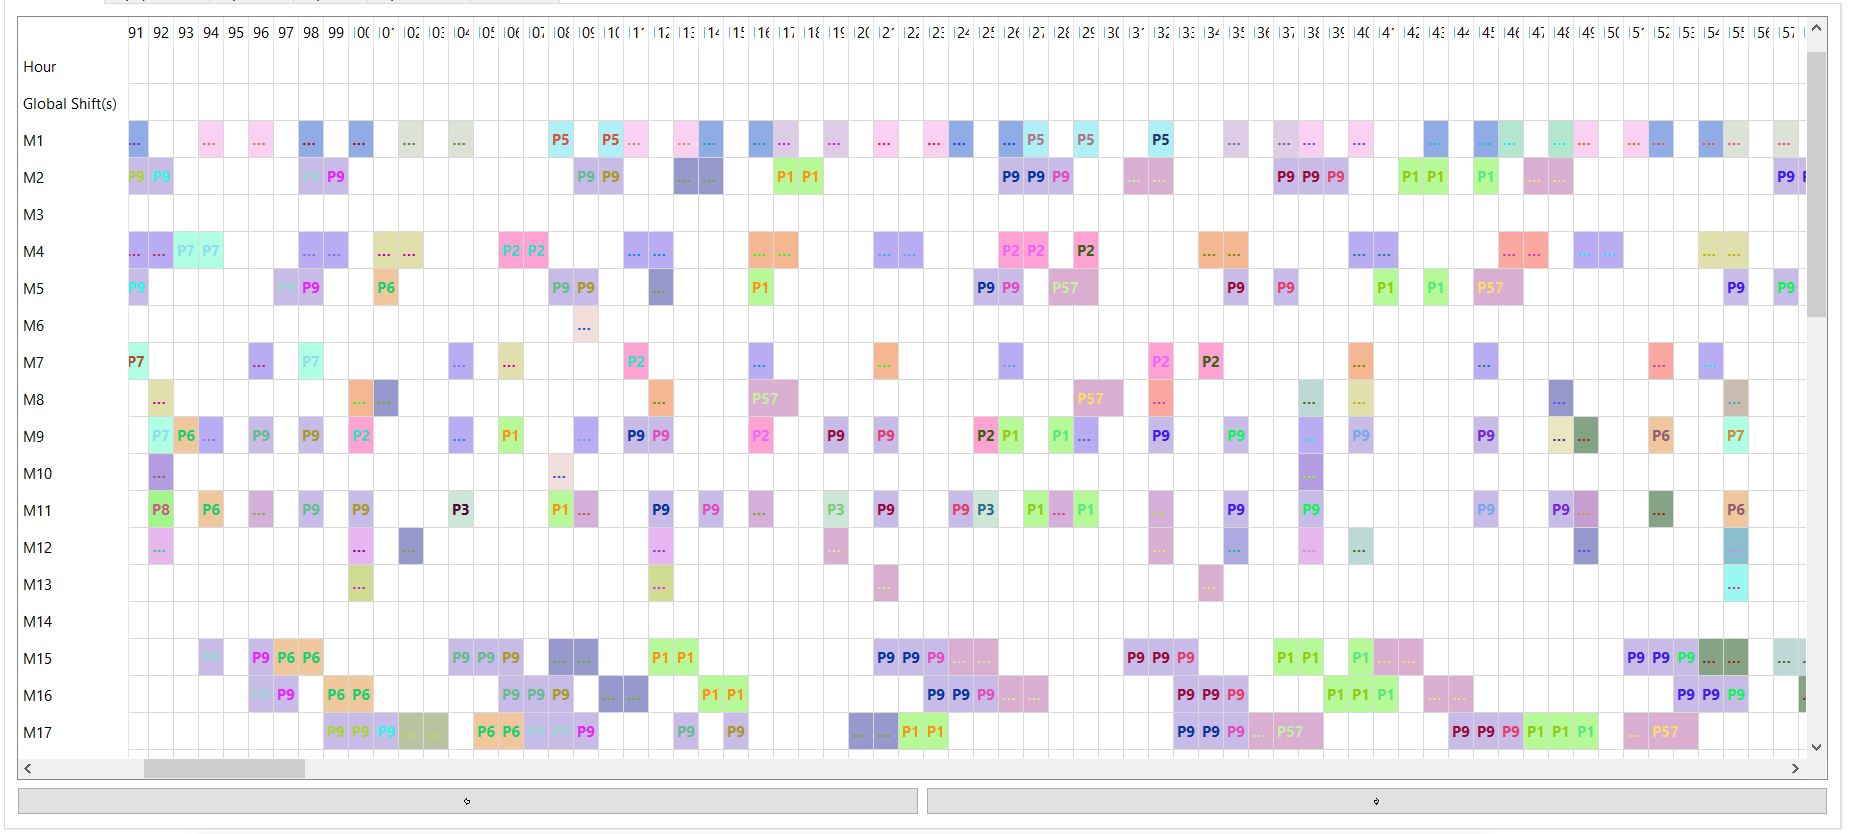
Once a schedule has been done, a detailed Gantt chart will be generated. This Gantt chart shows minute by minute which operation is done, on which product, on which machine, and if an operator is dedicated to it. To navigate further in the Gantt chart, you can use the arrows located at the bottom of the window.
The Operations table
The first table contains the details of each operation done during the schedule. It is possible to filter these informations based on the machine, the product, and/or the order.
- Id is the Id of the operation. It is only useful for sorting purposes.
- Name is the name of the operation. Usually, it is a combination of the product, the operation, the batch and the type of operation.
- Started at indicates the time at which the operation has been started.
- Ended at indicates the time at which the operation was ended.
- Type is the type of operation. It is one of the following : Setup, Load, Process, Unload, Measure or Transport.
- Machine is the machine on which the operation has been done.
- Operator is the operator who was in charge of the operation.
- Product is the id of the product. Use it sorting.
- Batch is the id of the batch. Use it for sorting
- Piece is the id of the piece. Use it for sorting.
- Wait Time is the amount of minutes the operation was on hold before being executed. 0 means that the operation started as soon as the previous one was finished.
Note that it is possible to export this table to CSV format, which can then be opened in Excel or any similar software.
The Orders table
The second table contains the details of each order treated during the schedule.
- Id is the Id of the order. It is only useful for sorting purposes.
- Name is the name of the order.
- Id Product is the id of the product. Use it for sorting.
- Id Batch is the id of the batch. Use it for sorting.
- Release Date indicates the date at which the order was available to be started.
- Real Start Date indicates the date at which the operations on the orders started.
- Due Date indicates the date at which the order should be done.
- Real End Date indicates the date at which the order was finished.
- Lead Time indicates the lead time of the order. It means the time that the order spent inside the factory, from the start of its first operation till the end of its last one.
- Lateness is the comparaison between the real end date and the planified due date.
Note that it is possible to export this table to CSV format, which can then be opened in Excel or any similar software.
The Units table
The third table contains the details of each unit processed during the schedule.
- Id is the Id of the order. It is only useful for sorting purposes.
- Name is the name of the unit.
- Id Order is the Id of the order. It is only useful for sorting purposes.
- Id Product is the id of the product. Use it for sorting.
- Id Batch is the id of the batch. Use it for sorting.
- Real Start Date indicates the date at which the operations on the unit started.
- Real End Date indicates the date at which the unit was finished.
- Lead Time indicates the lead time of the unit. It means the time that the product spent inside the factory, from the start of its first operation till the end of its last one.
Note that it is possible to export this table to CSV format, which can then be opened in Excel or any similar software.
The Resources table
The fourth table contains the details of each resource inside the factory.
- Id is the Id of the resource. It is only useful for sorting purposes.
- Code is the name of the resource.
- Shift indicates the shift on which the resource is. It can either be 1, 2 or 3.
- Average Wait Time is the average time a product has to wait in front of the machine before being treated by the machine.
- Nb Setups Done is the number of setups done on the resource for the whole schedule.
- Total Setup Time indicates the total time spent doing setups on the resource.
- Total L/P/U Time indicates the total time of load/process/unload done on the resource.
Note that it is possible to export this table to CSV format, which can then be opened in Excel or any similar software.
DAHSBOARD !!
The KPIs
The last tab of the schedule panel contains two parts. The first one is dedicated to the KPIs of the schedule.
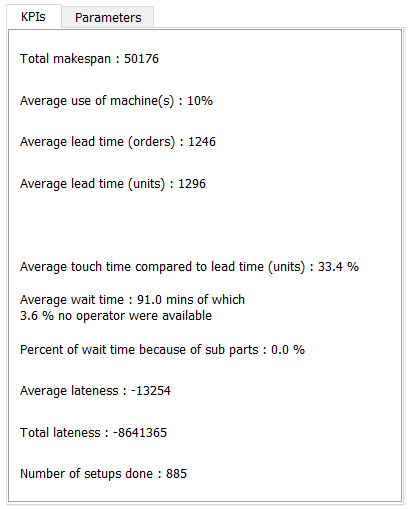
- Total Makespan is the total amount of time for the schedule in minutes.
- Average use of machines is the average percentage of machine utilization.
- Average lead time (orders) is the average lead time for the orders in minutes.
- Average lead time (units) same as above, but for each unit of product.
- Average touch time compared to lead time (units) is the average percentage of effective time spent on operation for each unit compared to the time it actually spent inside the factory.
- Average wait time is the average wait time for each operation. This also contains the percentage of wait time due to a shortage of operators.
- Percent of wait time because of sub parts is the percentage of wait time caused by sub parts not ready at time to be used by the main products.
- Average lateness is the average lateness for each order of the schedule.
- Total lateness is the total lateness in minutes for all the orders.
- Number of setups done is the total amount of setups done for the schedule.
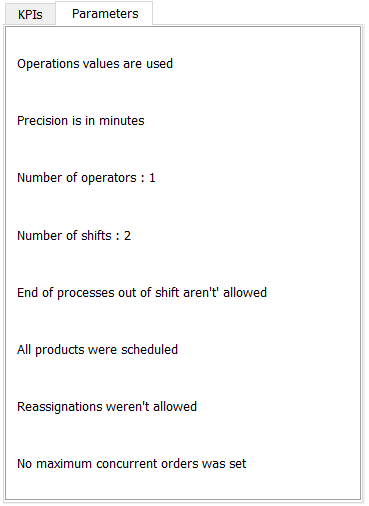
The Parameters
- This tab reminds the choices made before launching the schedule.
- Whether operation values are used or not
- The precision (seconds, minutes or hours)
- The number of operators
- The number of shifts
- If end of processes out of shft is allowed
- If all products were scheduled
- If reassignations are allowed
- The number of maximum concurrent orders
The Graphs
Each graph can be zoomed on by selecting the desired area using the mouse. There is also a reset button that reset the chart as it was before zooming.
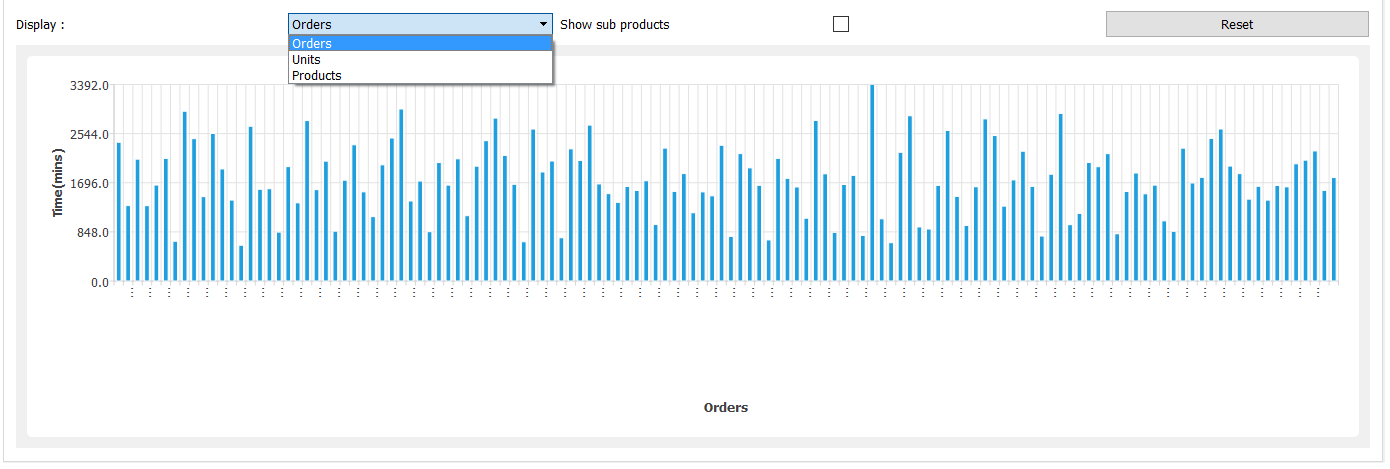
- Lead Time
- It displays the lead time in minutes for each order, unit or product of the schedule. The different charts can be obtained by selecting them in the combo box. The order chart is displayed by default. The check box enables the inclusion of the subproducts. By default they are not included.
- Start/End Time
- For each unit of product, it shows :
- The start time
- The end time
- The due date
- The release date
- The touch time
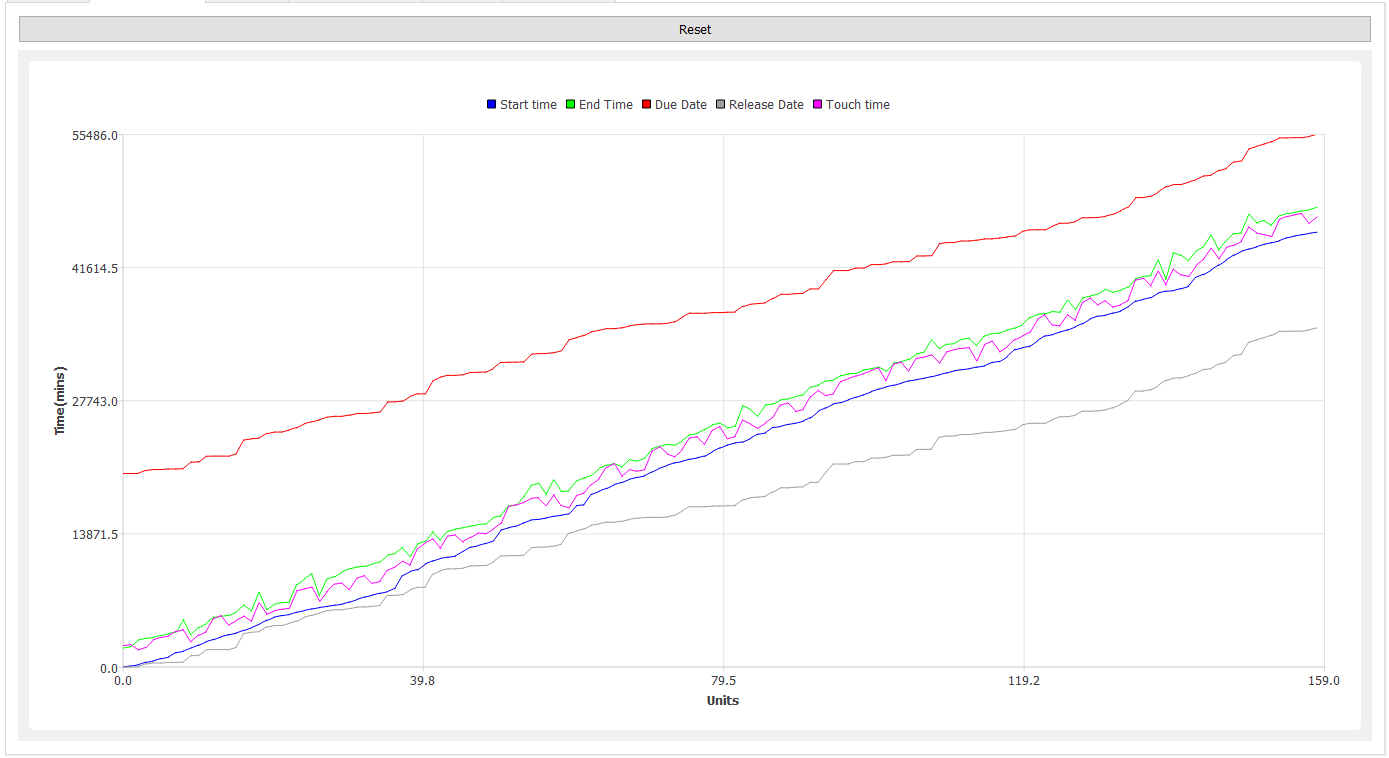
This graph is useful to have a quick look at the efficiency of the overal schedule. For a good situation, the end time should not grow much faster than the start time and it should be as close as possible to the touch time.
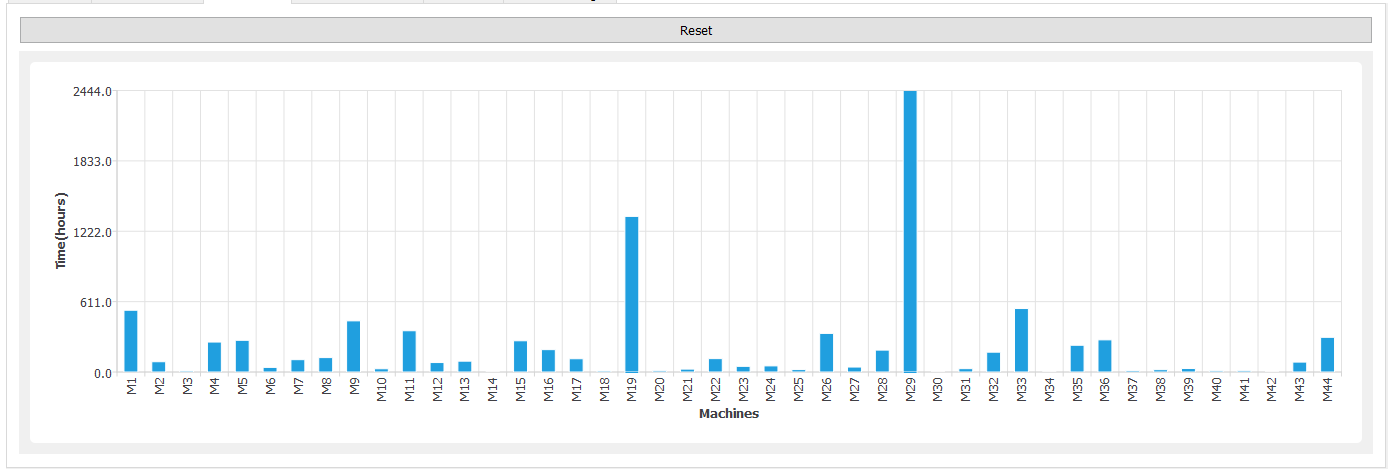
- Wait Time
- It shows the cumulated wait time (in hours) of the operations per machine. This graph can clearly indicate the bottleneck machines and where changes should be done to improve the effiency. For instance, if such a machine is duplicated it might greatly reduce the makespan (M29 or M19 on this picture).
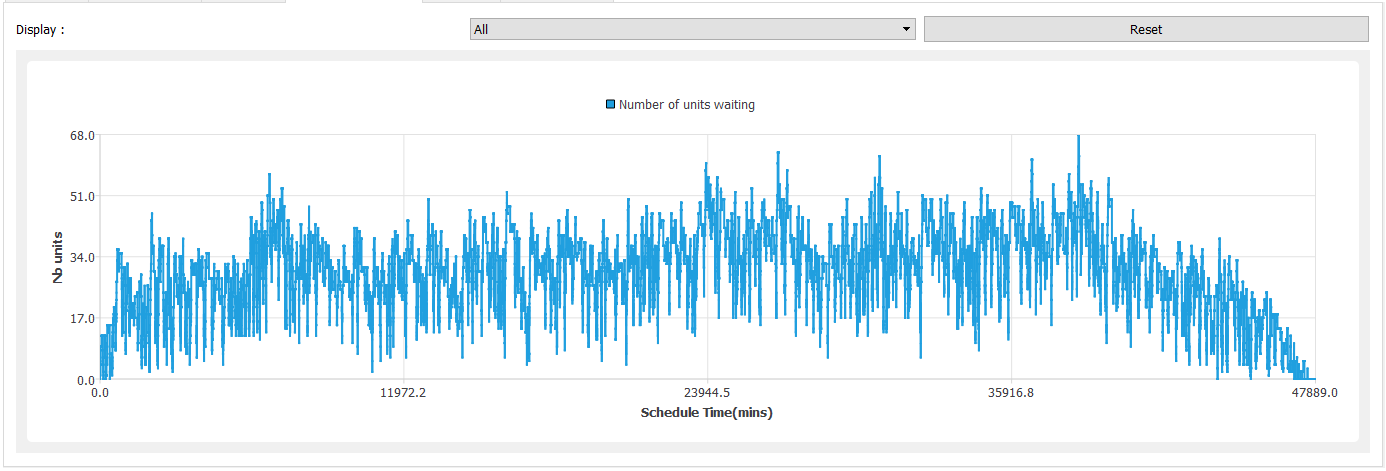
- Wait Time Timeline
- It shows, minute by minute, the number of units of product currently waiting to be treated inside the factory. By default, all the machines are included but the combo box allows to select only the desired machines. In this case, the graph will only show the number of units of product on hold in front of the selected machines. Combined with the previous graph, it can indicate which machines slow the process down so changes can be made.
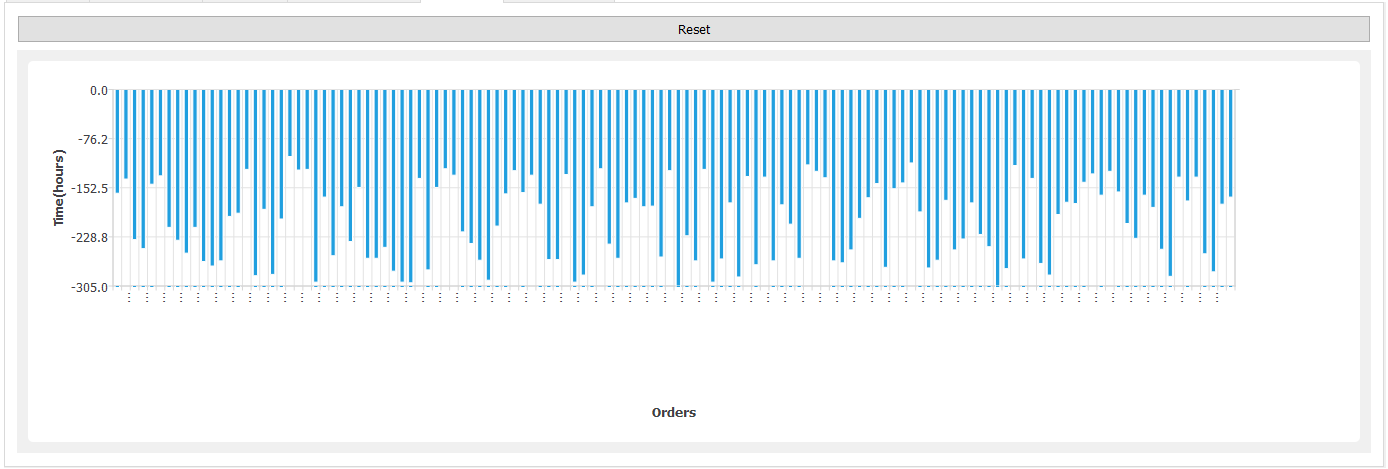
- Lateness
- It shows, for each order, the lateness. If the order has a negative lateness, i.e below the zero line, it means it will be ready in advance. Whereas if the lateness is positive, i.e it goes up the zero line, it means that the order will be finished after the expected due date, thus it will be late. An ideal situation would be to have negative lateness for each order as depicted on this picture.
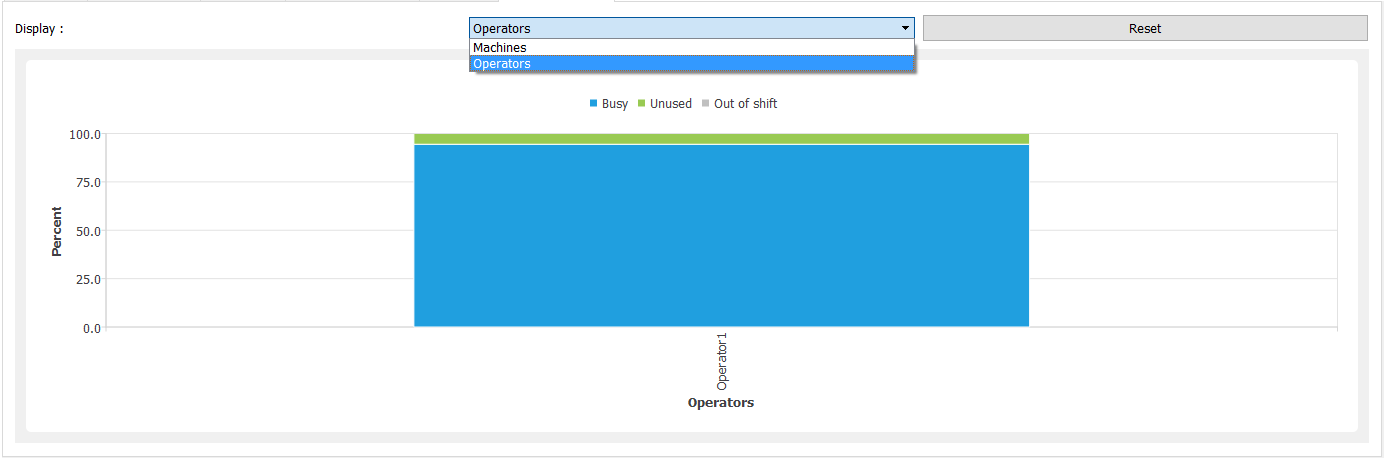
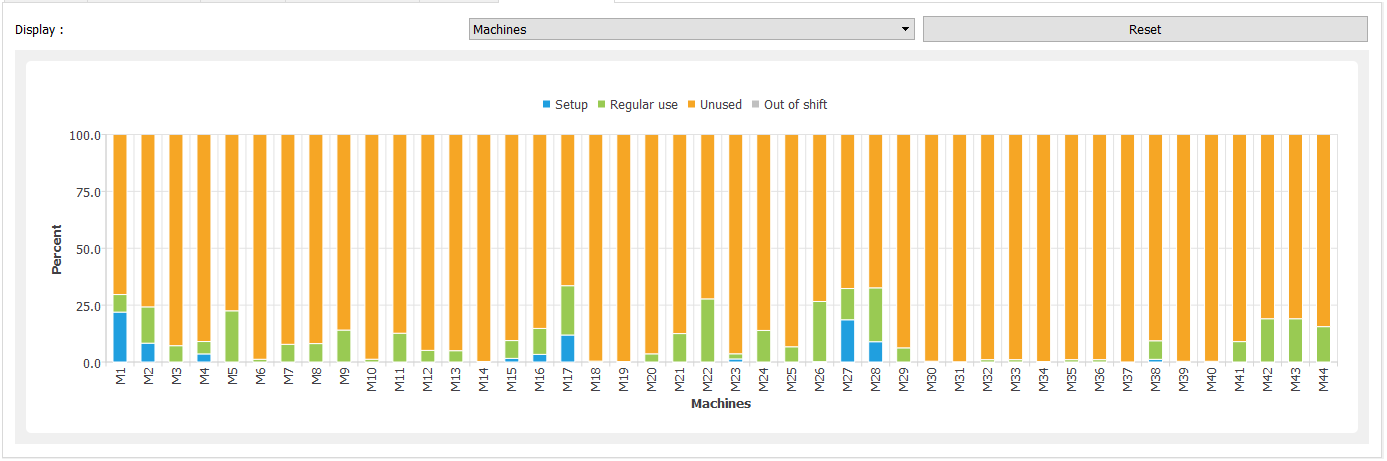
- Machine usage
- It shows, for each machine, the usage divided in :
- Setup time
- Load/Process/Unload time
- Unused
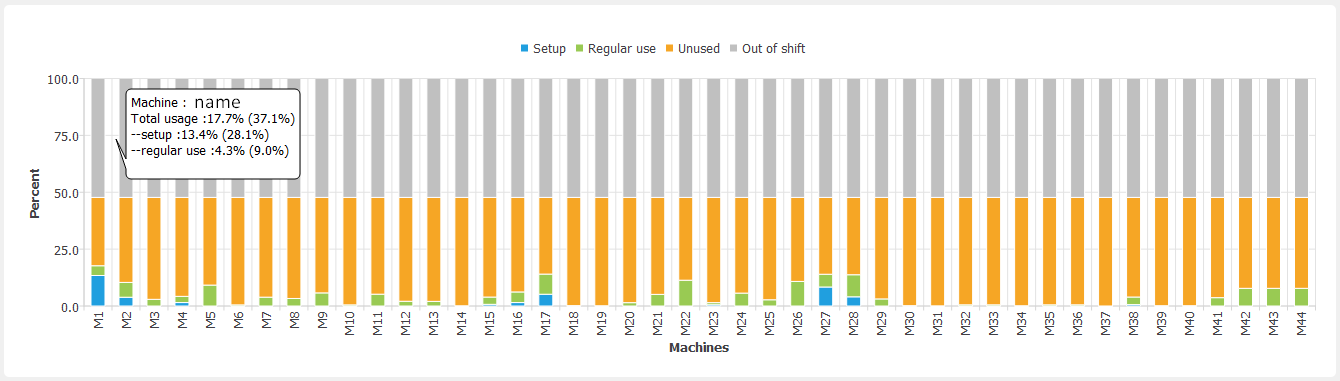
The machine can also be out of shift, in which case it will appear in grey.
When hovering on (moving the mouse above) any column, the exact name as well as the values of setup and regular use of the machine will appear in a bubble. For each data, the value indicated in brackets only takes into account the actual availability time of the machine. Whereas the first value also counts the time when the machine is out of shift. This value is thus always smaller or equal to the value in brackets.
The combo box allows to show the usage of the operators instead of the machines. If he is not out of shift, the operator can either be busy or unused.